CHAPTER 5: LAND COVER AND LAND-USE CHANGE
Changes in land cover continue to impact local- to global-scale weather and climate by altering the flow of energy, water, and greenhouse gases between the land and the atmosphere. Reforestation can foster localized cooling, while in urban areas, continued warming is expected to exacerbate urban heat island effects.
Key Message 2
Climate Impacts on Land and Ecosystems
Climate change affects land use and ecosystems. Climate change is expected to directly and indirectly impact land use and cover by altering disturbance patterns, species distributions, and the suitability of land for specific uses. The composition of the natural and human landscapes, and how society uses the land, affects the ability of the Nation’s ecosystems to provide essential goods and services.
Key Message 1
Changes in land cover continue to impact local- to global-scale weather and climate by altering the flow of energy, water, and greenhouse gases between the land and the atmosphere. Reforestation can foster localized cooling, while in urban areas, continued warming is expected to exacerbate urban heat island effects.
Key Message 2
Climate change affects land use and ecosystems. Climate change is expected to directly and indirectly impact land use and cover by altering disturbance patterns, species distributions, and the suitability of land for specific uses. The composition of the natural and human landscapes, and how society uses the land, affects the ability of the Nation’s ecosystems to provide essential goods and services.
Likelihood
| Virtually Certain | Extremely Likely | Very Likely | Likely | About as Likely as Not | Unlikely | Very Unikely | Extremely Unlikely | Exceptionally Unlikely |
|---|
| 99%–100% | 95%–100% | 90%–100% | 66%-100% | 33%-66% | 0%-33% | 0%-10% | 0%-5% | 0%-1% |
Confidence Level
| Very High | High | Medium | Low |
|---|
| Strong evidence (established theory, multiple sources, consistent results, well documented and accepted methods, etc.), high consensus | Moderate evidence (several sources, some consistency, methods vary and/or documentation limited, etc.), medium consensus | Suggestive evidence (a few sources, limited consistency, models incomplete, methods emerging, etc.), competing schools of thought | Inconclusive evidence (limited sources, extrapolations, inconsistent findings, poor documentation and/or methods not tested, etc.), disagreement or lack of opinions among experts |
Documenting Uncertainty: This assessment relies on two metrics to communicate the degree of certainty in Key Findings. See Guide to this Report for more on assessments of likelihood and confidence.
VIEW THE EXECUTIVE SUMMARY
EXECUTIVE SUMMARY:
Chapter 5: Land Cover and Land-Use Change
Executive Summary
Climate can affect and be affected by changes in land cover (the physical features that cover the land such as trees or pavement) and land use (human management and activities on land, such as mining or recreation). A forest, for instance, would likely include tree cover but could also include areas of recent tree removals currently covered by open grass areas. Land cover and use are inherently coupled: changes in land-use practices can change land cover, and land cover enables specific land uses. Understanding how land cover, use, condition, and management vary in space and time is challenging.
Changes in land cover can occur in response to both human and climate drivers. For example, demand for new settlements often results in the permanent loss of natural and working lands, which can result in localized changes in weather patterns, temperature, and precipitation. Aggregated over large areas, these changes have the potential to influence Earth’s climate by altering regional and global circulation patterns, changing the albedo (reflectivity) of Earth’s surface, and changing the amount of carbon dioxide (CO2) in the atmosphere. Conversely, climate change can also influence land cover, resulting in a loss of forest cover from climate-related increases in disturbances, the expansion of woody vegetation into grasslands, and the loss of beaches due to coastal erosion amplified by rises in sea level.
Land use is also changed by both human and climate drivers. Land-use decisions are traditionally based on short-term economic factors. Land-use changes are increasingly being influenced by distant forces due to the globalization of many markets. Land use can also change due to local, state, and national policies, such as programs designed to remove cultivation from highly erodible land to mitigate degradation, 1 legislation to address sea level rise in local comprehensive plans, or policies that reduce the rate of timber harvest on federal lands. Technological innovation has also influenced land-use change, with the expansion of cultivated lands from the development of irrigation technologies and, more recently, decreases in demand for agricultural land due to increases in crop productivity. The recent expansion of oil and gas extraction activities throughout large areas of the United States demonstrates how policy, economics, and technology can collectively influence and change land use and land cover.
Decisions about land use, cover, and management can help determine society’s ability to mitigate and adapt to climate change.
Changes in Land Cover by Region
CLICK HERE TO INTERACT
Select Land Cover Classes
Agriculture
Grass/Shrub
Select Disturbance Types
Mechanical
Nonmechanical
The figure shows the net change in land cover by class in square miles, from 1973 to 2011. Land-cover change has been highly dynamic over space, time, and sector, in response to a range of driving forces. Net change in land cover reveals the trajectory of a class over time. A dramatic example illustrated here is the large decline in agricultural lands in the two Great Plains regions beginning in the mid-1980s, which resulted in large part from the establishment of the Conservation Reserve Program. Over the same period, agriculture also declined in the Southwest region; however, the net decline was largely attributable to prolonged drought conditions, as opposed to changes in federal policy. Data for the period 1973–2000 are from Sleeter et al. 2013 2 , while data from 2001–2011 are from the National Land Cover Database (NLCD). 3 Note: the two disturbance categories used for the 1973–2000 data were not included in the NLCD data for 2001–2011 and largely represent conversions associated with harvest activities (mechanical disturbance) and wildfire (nonmechanical disturbance). Comparable data are unavailable for the U.S. Caribbean, Alaska, and Hawai’i & U.S.-Affiliated Pacific Islands regions, precluding their representation in this figure. From Figure 5.2 (Source: USGS).
HIDE THE EXECUTIVE SUMMARY
CHAPTER 5
Land Cover and Land-Use Change
Introduction
Authors
Federal Coordinating Lead Author: Thomas Loveland, U.S. Geological Survey Chapter Lead: Benjamin M. Sleeter, U.S. Geological Survey Chapter Authors: James Wickham, U.S. Environmental Protection Agency Grant Domke, U.S. Forest Service Nate Herold, National Oceanic and Atmospheric Administration Nathan Wood, U.S. Geological Survey Review Editor: Georgine Yorgey, Washington State University
Contributors
Technical Contributors: Tamara S. Wilson, U.S. Geological Survey Jason Sherba, U.S. Geological Survey USGCRP Coordinators: Susan Aragon-Long, Senior Scientist Christopher W. Avery, Senior Manager
Recommended Citation
Sleeter, B.M., T. Loveland, G. Domke, N. Herold, J. Wickham, and N. Wood, 2018: Land Cover and Land-Use Change. In Impacts, Risks, and Adaptation in the United States: Fourth National Climate Assessment, Volume II [Reidmiller, D.R., C.W. Avery, D.R. Easterling, K.E. Kunkel, K.L.M. Lewis, T.K. Maycock, and B.C. Stewart (eds.)]. U.S. Global Change Research Program, Washington, DC, USA, pp. 202–231. doi: 10.7930/NCA4.2018.CH5
Related Links
Climate can affect and be affected by changes in land cover (the physical features that cover the land, such as trees or pavement) and land use (human management and activities on land, such as mining or recreation). A forest, for instance, would likely include tree cover but could also include areas of recent tree removals currently covered by open grass areas. Land cover and use are inherently coupled: changes in land-use practices can change land cover, and land cover enables specific land uses. Understanding how land cover, use, condition, and management vary in space and time is challenging, because while land cover and condition can be estimated using remote sensing techniques, land use and management typically require more local information, such as field inventories. Identifying, quantifying, and comparing estimates of land use and land cover are further complicated by factors such as consistency and the correct application of terminology and definitions, time, scale, data sources, and methods. While each approach may produce land-use or land-cover classifications, each method may provide different types of information at various scales, so choosing appropriate data sources and clearly defining what is being measured and reported are essential.
Changes in land cover can occur in response to both human and climate drivers. For example, the demand for new settlements often results in the permanent loss of natural and working lands, which can result in localized changes in weather patterns, 4 , 5 temperature, 6 , 7 and precipitation. 8 Aggregated over large areas, these changes have the potential to influence Earth’s climate by altering regional and global circulation patterns, 9 , 10 , 11 changing the albedo (reflectivity) of Earth’s surface, 12 , 13 and changing the amount of carbon dioxide (CO2) in the atmosphere. 14 , 15 Conversely, climate change can also influence land cover, resulting in a loss of forest cover from climate-related increases in disturbances, 16 , 17 , 18 the expansion of woody vegetation into grasslands, 19 and the loss of coastal wetlands and beaches due to increased inundation and coastal erosion amplified by rises in sea level. 20
Changes in land use can also occur in response to both human and climate drivers. Land-use decisions are often based on economic factors. 21 , 22 , 23 Land-use changes are increasingly being influenced by distant forces due to the globalization of many markets. 21 , 24 , 25 , 26 Land use can also change due to local, state, and national policies, such as programs designed to remove cultivation from highly erodible land to mitigate degradation, 1 legislation to address sea level rise in local comprehensive plans, 27 and policies that reduce the rate of timber harvest on federal lands 28 , 29 or promote the expansion of cultivated lands for energy production. 30 Technological innovation has also influenced land-use change, with the expansion of cultivated lands from the development of irrigation technologies 31 , 32 and, more recently, decreases in demand for agricultural land due to increases in crop productivity. 33 The recent expansion of oil and gas extraction activities throughout large areas of the United States demonstrates how policy, economics, and technology can collectively influence and change land use and land cover. 34
Land use also responds to changes in climate and weather. For example, arable land (land that is suitable for growing crops) may be fallowed (left uncultivated) or abandoned completely during periods of episodic drought 35 , 36 or converted to open water during periods of above-normal precipitation. 37 Increased temperatures have also been shown to have a negative effect on agricultural yields (Ch. 10: Ag & Rural, KM 1). 38 Climate change can also have positive impacts on land use, such as increases in the length of growing seasons, particularly in northern latitudes. 39 , 40 , 41 Forest land use is also susceptible to changes in weather and climate (Ch. 6: Forests). For example, the recent historical drought in California has resulted in a significant forest die-off event, 42 , 43 which has implications for commercial timber production. Similarly, insect outbreaks across large expanses of western North American forests have been linked to changes in weather and climate, 17 which in turn may result in important feedbacks on the climate system. 44 Sea level rise associated with climate change will likely require changes in coastal land use, as development and infrastructure are increasingly impacted by coastal flooding. 27 , 45 , 46 , 47 As sea levels rise, many coastal areas will likely experience increased frequency and duration of flooding events, and impacts may be felt in areas that have not experienced coastal flooding in the past (Ch. 8: Coastal, KM 1).
Decisions about land use, cover, and management can help determine society’s ability to mitigate and adapt to climate change. Reducing atmospheric greenhouse gas (GHG) concentrations can, in part, be achieved by increasing the land-based carbon storage. 48 Increasing this carbon storage can be achieved by increasing the area of forests, stabilizing or increasing carbon stored in soils 49 , 50 and forests (Ch. 6: Forests), 51 avoiding the release of stored carbon due to disturbances (such as wildfire) through forest management practices (Ch. 6: Forests, KM 3), 52 , 53 and increasing the carbon stored in wood products. 54 However, there are large uncertainties about what choices will be made in the future and the net effects of the resulting changes in land use and land cover. 55 , 56 , 57
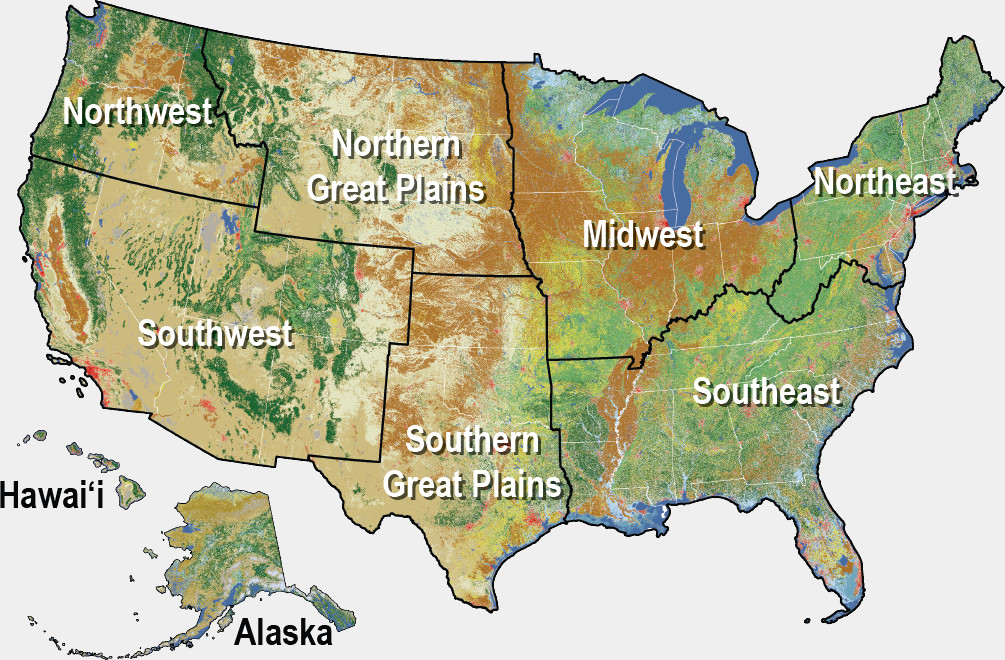
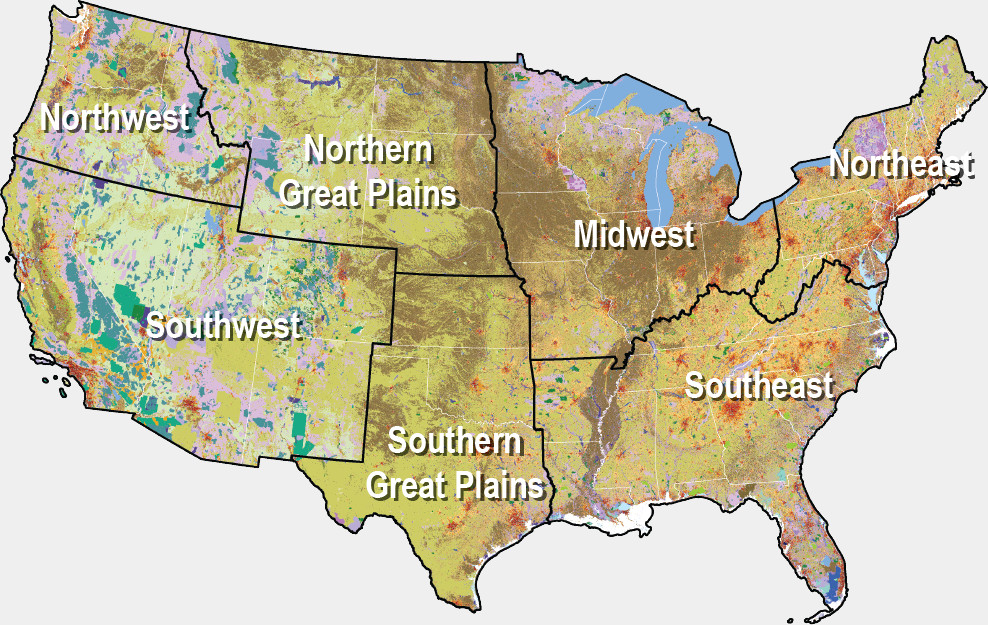
State of the Sector
Humans have had a far-reaching impact on land cover within the contiguous United States. Of the approximately 3.1 million square miles of land area, approximately 28% has been significantly altered by humans for use as cultivated cropland and pastures (22%) or settlements (6%; Figure 5.1a). 3 Land uses associated with resource production (such as grazing, cropland, timber production, and mining) account for more than half of the land area of the contiguous United States, 58 followed by land that is conserved (16%), built-up areas (13%), and recreational land (10%; Figure 5.1b). Between 2001 and 2011, developed land cover increased by 5% and agriculture declined by 1%. Urbanization was greater between 2001 and 2006 than between 2006 and 2011, which may be attributable to the 2007–2009 economic recession. 59 , 60 The relative stability in agricultural land use between 2001 and 2011 masks widespread fluctuations brought about by the abandonment and expansion of agricultural lands (see Figure 5.2 for more detail).
Figure 5.1: Land-Use and Land-Cover Composition
CLICK HERE TO INTERACT
Figure 5.1.a: Land Cover Composition of the United States
Sort Land Cover Sectors
Zoom into Region
Stacked Switch rendering of bars
Figure 5.1.b: Land Use Composition of the United States
Sort Land Use Sectors
Zoom into Region
Stacked Switch rendering of bars
Table 5.1: Estimates of Land-Use Area (Square Miles) by NCA Region
| NCA Region | Croplands | Forestlands | Grasslands | Other Lands | Settlements | Wetlands |
|---|
| Alaska | 111 | 133,438 | 305,659 | 76,388 | 558 | 64,336 |
|---|
| Hawai'i | 173 | 2,501 | 1,997 | 1,283 | 438 | 51 |
|---|
| Midwest | 212,994 | 142,314 | 43,753 | 4,140 | 36,638 | 18,867 |
|---|
| Northern Great Plains | 136,089 | 62,829 | 248,678 | 4,473 | 8,216 | 9,765 |
|---|
| Northeast | 24,490 | 131,383 | 11,649 | 2,929 | 24,856 | 12,521 |
|---|
| Northwest | 28,076 | 114,263 | 89,963 | 3,853 | 7,784 | 5,573 |
|---|
| Southern Great Plains | 103,698 | 103,325 | 182,216 | 2,547 | 19,878 | 7,790 |
|---|
| Southeast | 84,137 | 301,616 | 58,442 | 3,610 | 45,799 | 34,852 |
|---|
| Southwest | 39,782 | 174,669 | 416,464 | 30,324 | 22,311 | 10,237 |
|---|
| Total | 629,550 | 1,166,338 | 1,358,821 | 129,547 | 166,478 | 163,992 |
|---|
Table 5.1: Definitions of land use and land cover vary among agencies and entities collecting those data. This may lead to fundamental differences in these estimates that must be considered when comparing estimates of cover and use. For the purposes of this report, land cover is defined as the physical characteristics of land, such as trees or pavement, and land use is characterized by human management and activities on land, such as mining or recreation. The land-use area estimates in this table and throughout this chapter were obtained from the U.S. Forest Service’s Forest Inventory and Analysis (FIA) Program and the National Resources Conservation Service’s (NRCS) Natural Resources Inventory (NRI) data, when available for an area, because the surveys contain additional information on management, site conditions, crop types, biometric measurements, and other data that are needed to estimate carbon stock changes and nitrous oxide and methane emissions on those lands. If NRI and FIA data are not available for an area, however, then the NLCD product is used to represent the land use. Since all three data sources were used in the land representation analysis within the National Inventory Report, we used land-use estimates from the U.S. Environmental Protection Agency’s annual greenhouse gas inventory report. 61 Data are unavailable for both the U.S. Caribbean region and the U.S.-Affiliated Pacific Islands in the NRI and FIA datasets.
Vegetated land cover, including grasslands, shrublands, forests, and wetlands, accounted for approximately two-thirds of the contiguous U.S. land area and experienced a net decline of approximately 5,150 square miles between 2001 and 2011. However, many of these areas are also used for the production of ecosystem goods and services, such as timber and grazing, which lead to changes in land cover but may not necessarily result in a land-use change. Between 2001 and 2011, forest land cover had the largest net decline of any class (25,730 square miles) 3 but forest land use increased by an estimated 3,200 square miles over a similar period (Ch. 6: Forests). 61 The increase in forest land use is due, in large part, to the conversion of abandoned croplands to forestland 62 and the reversion to and expansion of trees in grassland ecosystems in the Great Plains and western United States. 61 There have also been losses in forest land use over the past 25 years, predominantly to grasslands and settlements, with grasslands and shrublands increasing in area by nearly 20,460 square miles. Collectively, non-vegetated areas, including water, barren areas, and snow and ice, account for approximately 6% of the total land area.
Figure 5.2: Changes in Land Cover by Region
CLICK HERE TO INTERACT
Select Land Cover Classes
Agriculture
Grass/Shrub
Select Disturbance Types
Mechanical
Nonmechanical
Select Region
Figure 5.2: The figure shows the net change in land cover by class in square miles, from 1973 to 2011. Land-cover change has been highly dynamic over space, time, and sector, in response to a range of driving forces. Net change in land cover reveals the trajectory of a class over time. A dramatic example illustrated here is the large decline in agricultural lands in the two Great Plains regions beginning in the mid-1980s, which resulted in large part from the establishment of the Conservation Reserve Program. Over the same period, agriculture also declined in the Southwest region; however, the net decline was largely attributable to prolonged drought conditions, as opposed to changes in federal policy. Data for the period 1973–2000 are from Sleeter et al. (2013) 2 , while data from 2001–2011 are from the National Land Cover Database (NLCD). 3 Note: the two disturbance categories used for the 1973–2000 data were not included in the NLCD data for 2001–2011 and largely represent conversions associated with harvest activities (mechanical disturbance) and wildfire (nonmechanical disturbance). Comparable data are unavailable for the U.S. Caribbean, Alaska, and Hawai’i & U.S.-Affiliated Pacific Islands regions, precluding their representation in this figure. Source: USGS.
Coastal regions, as mapped within the National Oceanic and Atmospheric Administration’s (NOAA) Coastal Change Analysis Program (C-CAP), account for 23% of the contiguous U.S. land area and have been particularly dynamic in terms of change, accounting for approximately 50% of all land-cover change and 43% of all urbanization in the contiguous United States. Approximately 8% of the coastal region changed between 1996 and 2010, which included about 16,500 square miles of forest loss and about 5,700 square miles of gain in urban land, a rate three times higher than that of the interior of the United States. Additionally, nearly 1,550 square miles of wetlands were lost in coastal regions, a trend counter to that of the Nation as a whole. A majority of this wetland loss has occurred in the northern Gulf of Mexico (Ch. 8: Coastal; Ch. 19: Southeast). 63 Coastal shoreline counties comprise approximately 10% of the United States in terms of land cover (excluding Alaska and the U.S. Caribbean) yet represent 39% of the U.S. population (2010 estimates), with population densities six times higher than in non-coastal areas. 64 Between 1970 and 2010, the population in coastal areas increased by nearly 40% and is projected to increase by an additional 10 million people over 2010–2020 (Figure 5.3). 64 Increases in the frequency of high tide flooding and extreme weather events (such as hurricanes and nor’easters), wetland loss, and beach loss from sea level rise present potential threats to people and property in the coastal zone (Ch. 8: Coastal, KM 1; Ch. 18: Northeast; Ch. 19: Southeast, KM 2).
Figure 5.3: Development in the Houston Area
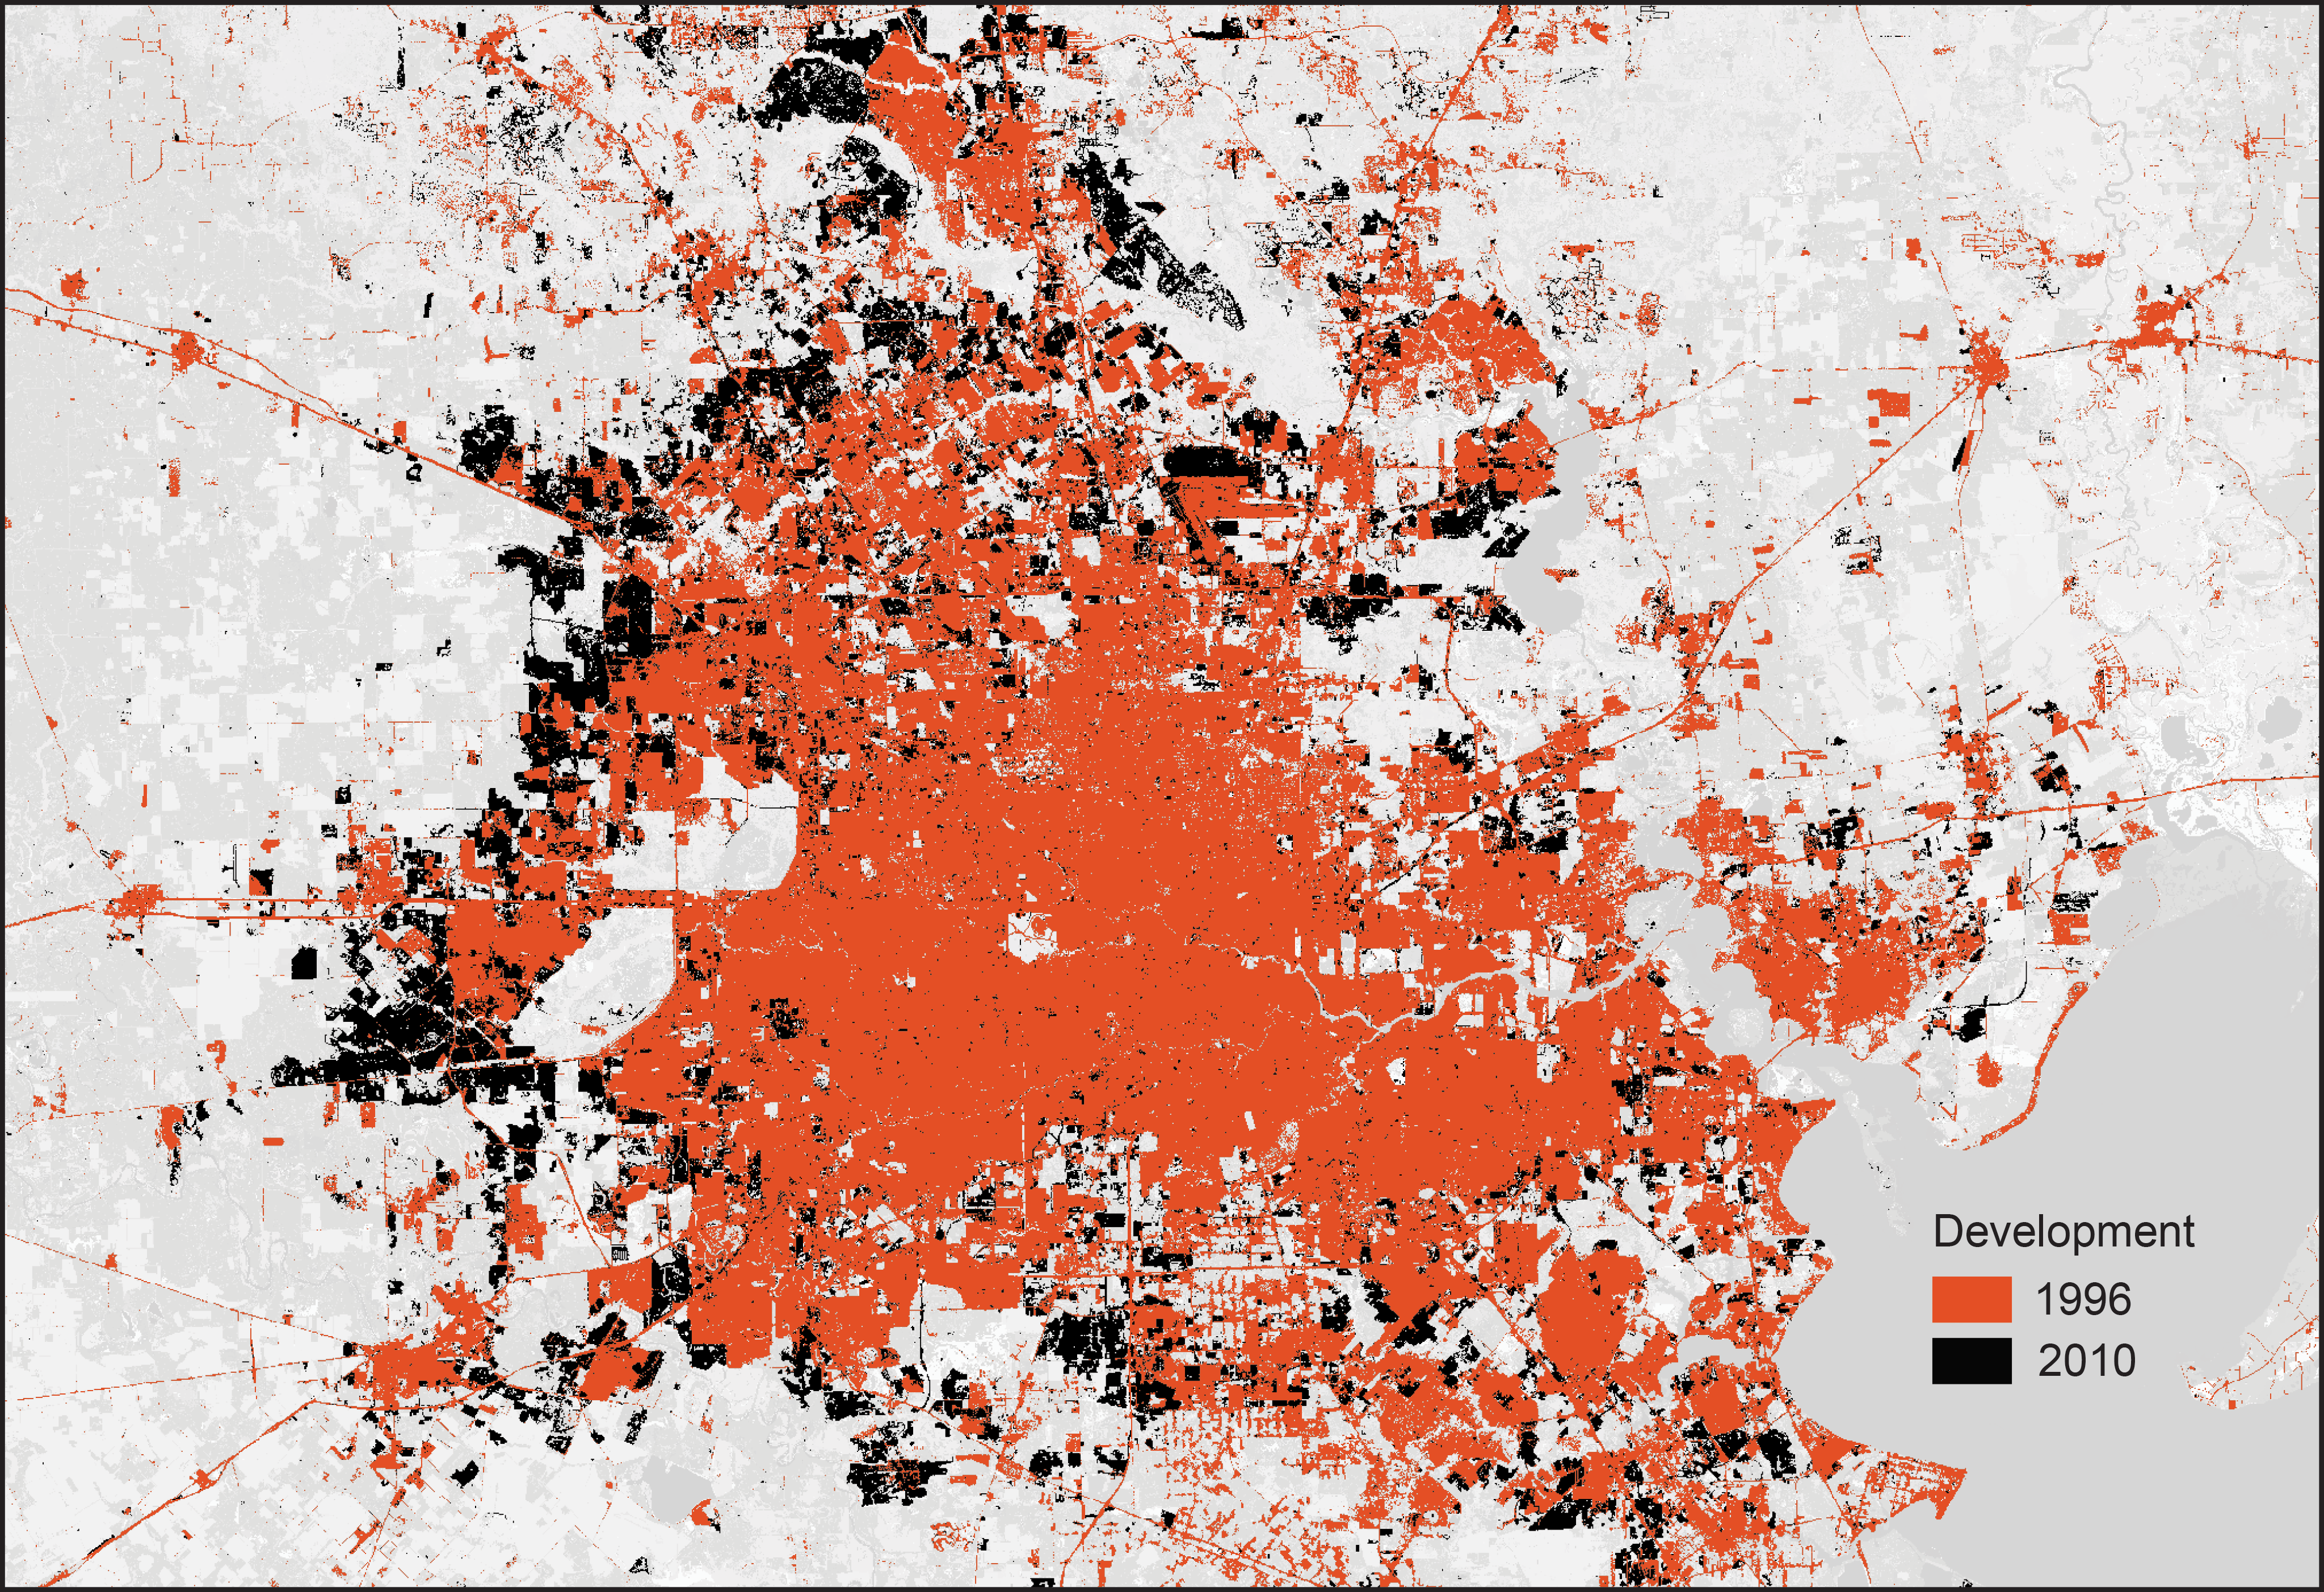
A map of Houston, Texas, shows its expanse of developed land cover in 1996 compared to the development-related changes that occurred between 1996 and 2010. From 1996 to 2010, the Houston area underwent significant development, especially the northern and western portions of the city.
Figure 5.3: The figure shows the development-related changes surrounding Houston, Texas, from 1996 to 2010, as mapped by NOAA’s Coastal Change and Analysis Program (C-CAP). Areas of change between 1996 and 2010 are shown in black. 63 These changes can have numerous impacts on the environment and populations, ranging from increased urban heat island effects and storm water runoff (the latter of which can increase flooding and produce water quality impacts), to decreases in natural cover. Source: USGS.
Disturbance events (such as wildfire and timber harvest) are important factors that influence land cover. For example, forest disturbances can initiate a succession from forest to herbaceous grasslands to shrublands before forest reestablishment, with each successional stage having a different set of feedbacks with the climate. The length of an entire successional stage varies based on local environmental characteristics. 65 Permanent transitions to new cover types after a disturbance are also possible for many reasons, including the establishment of invasive or introduced species that are able to quickly establish and outcompete native vegetation. 66 , 67 Data from the North American Forest Dynamics dataset indicate that forest disturbances affected an average of approximately 11,200 square miles per year in the contiguous United States from 1985 to 2010 (an area greater than the entire state of Massachusetts). Between 2006 and 2010, the rate of forest disturbance declined by about one-third. 68 Although these data include a wide range of disturbance agents, including fire, insects, storms, and harvest, the sharp decline likely corresponds to a reduction in timber harvest activities resulting from a drop in demand for construction materials following the 2007–2009 economic recession. Wildland fires provide a good example of how ecosystem disturbance, climate change, and land management can interact. Between 1979 and 2013, the number of days with weather conditions conducive to fire has increased globally, including in the United States. 69 At the same time, human activities have expanded into areas of uninhabited forests, shrublands, and grasslands, 70 exposing these human activities to greater risk of property and life loss at this wildland–urban interface. 71 , 72 Over the last two decades, the amount of forest area burned and the expansion of human activity into forests and other wildland areas have increased. 73 These changes in climate and patterns of human activity have led in part to the development of a national strategy for wildland fire management for the United States. The strategy, published in 2014, was one outcome of the Federal Land Assistance, Management, and Enhancement (FLAME) Act of 2009. An important component of the national strategy 74 is a classification of U.S. counties based on their geographic context; fire history; amount of urban, forest, and range land; and other factors. The land-use, land-cover, and other components of the classification model are used to guide management actions.
Future Changes
Representative Concentration Pathways (RCPs) were developed to improve society’s understanding of plausible climate and socioeconomic futures. 75 U.S. projections of land-use and land-cover change (LULCC) developed for the RCPs span a wide range of future climate conditions, including a higher scenario (RCP8.5) 76 and three mitigation scenarios (RCP2.6, RCP4.5, and RCP6.0) (for more on RCPs, see Front Matter and the Scenario Products section in App. 3). 77 , 78 , 79 Projected changes in land use within each scenario were harmonized with historical data 80 and include a broad range of assumptions, from aggressive afforestation (the establishment of a forest where there was no previous tree cover) in the Midwest and Southeast (RCP4.5) to large-scale expansion of agricultural lands to meet biofuel production levels (RCP2.6; see Hibbard et al. 2017 81 ). The Shared Socioeconomic Pathways (SSPs) have been developed to explore how future scenarios of climate change interact with alternative scenarios of socioeconomic development (in terms of population, economic growth, and education) to understand climate change impacts, adaptation and mitigation, and vulnerability. 82 , 83 In a scenario with medium barriers to climate mitigation and adaptation (SSP2) and a scenario with high barriers to climate mitigation (SSP5), the amount of land devoted to developed use (for example, urban and suburban areas) is projected to increase by 50% and 80%, respectively, from 2010 levels by the year 2100. These changes represent a potential loss of between 500,000 and 620,000 square miles of agricultural or other vegetated lands (for more on SSPs, see the Scenario Products section of App. 3). 84 Future changes in land use are likely to have far-reaching impacts on other sectors. For example, by mid-century, water use in California is projected to increase by 1.5 million acre-feet, driven almost entirely by a near 60% increase in developed water-use demand. 85 Research in Hawai‘i projects a steady reduction in the strength of the state’s annual ecosystem carbon sink, resulting primarily from a combination of urbanization and a shift toward drier, less productive ecosystems by mid-century. 86

Land-Cover Changes Influence Weather and Climate
Changes in land cover continue to impact local- to global-scale weather and climate by altering the flow of energy, water, and greenhouse gases between the land and the atmosphere. Reforestation can foster localized cooling, while in urban areas, continued warming is expected to exacerbate urban heat island effects.
The influence of land-use and land-cover change (LULCC) on climate and weather is complex, and specific effects depend on the type of change, the scale of the assessment (local, regional, or global), the size of the area under consideration, the aspect of climate and weather being evaluated (such as temperature, precipitation, or seasonal trends), and the region where the change occurs. 87 , 88 Recent studies suggest that forests tend to be cooler than herbaceous croplands throughout much of the temperate region. 89 , 90 , 91 , 92 , 93 , 94 , 95 , 96 These studies suggest that reforestation in the temperate forest region would promote cooling, with the magnitude of cooling decreasing with increasing latitude. 90 , 94 , 95 , 96 , 97 The scale of the cooling from reforestation would depend on its extent and location. Biogeophysical (albedo, surface roughness, and transpiration) changes arising from land-cover change tend to result in more localized changes, whereas biogeochemical changes (such as carbon sequestration) tend to have a more global reach. Reforestation in the temperate forest region is an effective climate mitigation and adaptation strategy. 90 , 94 Fires in forests, grasslands, shrublands, and agricultural lands affect climate in two ways: 1) transporting carbon from the land to the atmosphere in the form of carbon dioxide and other greenhouse gases, and 2) increasing the concentration of small particles (aerosols) in the atmosphere that tend to reduce the amount of solar energy reaching the surface of Earth by increasing (although often temporarily) the reflectivity of the atmosphere. 98 Climate is also a principal determinant of an area’s fire regime, 99 which refers to the pattern in which fires occur within ecosystems based on factors such as size, severity, and frequency. Studies suggest that most aspects of the fire regime are increasing in the United States (Ch. 6: Forests, KM 1; Ch. 26: Alaska). 18 , 99 , 100 , 101 However, the true extent of an altered fire regime’s influence on climate is unclear, because the warming attributable to carbon releases to the atmosphere and decreases in surface albedo (at least temporarily) may be offset by increased reflectivity of the atmosphere from the increased concentration of small particles and the enhanced storage of carbon due to forest regrowth. 99 Urban regions include several characteristics that can influence climate, 102 including construction materials that absorb more heat than vegetation and soils do, impervious cover that minimizes the cooling effect of evapotranspiration, the canyon-like architecture of buildings that tends to trap heat, and heat generation from vehicle and building emissions. 103 , 104 These factors make urban areas warmer than their surroundings, a phenomenon referred to as the urban heat island (UHI) effect. Urbanization has a small effect on global temperatures, with more dramatic effects evident regionally where urbanization is extensive. 105 , 106 , 107 The local-scale UHI impact is relative to the regional climate such that its effect tends to be more severe in the eastern United States and declines westward. 10 , 108 , 109 , 110 , 111 Although the evidence is not conclusive, urbanization may also increase downwind precipitation. 112 , 113 , 114 Further, climate change may act synergistically with future urbanization (that is, an increase in impervious cover), resulting in increased likelihoods and magnitudes of flood events (e.g., Hamdi et al. 2011, Huong and Pathirana 2013 115 , 116 ). Water transport and application to cropland also impact climate. Between 2002 and 2007, irrigated lands expanded by approximately 1.3 million acres in the United States, with much of the change occurring in the Great Plains regions. 117 Approximately 88.5 million acre-feet of water were applied to approximately 55 million acres of irrigated agriculture in the United States in 2012. 118 Globally, the amount of water transported to the atmosphere through irrigated agriculture is roughly equivalent to the amount of water not transported to the atmosphere from deforestation. 119 Studies have shown reductions in surface air temperatures in the vicinity of irrigation due to both evaporation effects 120 , 121 , 122 and increases in downwind precipitation as a result of increased atmospheric moisture. 123 These potentially local-to-regional cooling effects are also counterbalanced by constraints on the availability of water for irrigation. 124

Climate Impacts on Land and Ecosystems
Climate change affects land use and ecosystems. Climate change is expected to directly and indirectly impact land use and cover by altering disturbance patterns, species distributions, and the suitability of land for specific uses. The composition of the natural and human landscapes, and how society uses the land, affects the ability of the Nation’s ecosystems to provide essential goods and services.
Climate can drive changes in land cover and land use in several ways, including changes in the suitability of agriculture (Ch. 10: Ag & Rural), 125 , 126 increases in fire frequency and extent (Ch. 6: Forests), 18 , 101 the loss or migration of coastal wetlands, 127 and the spatial relocation of natural vegetation. The extent of the climate influence is often difficult to determine, given that changes occur within interconnected physical and socioeconomic systems, and there is a lack of comprehensive observational evidence to support the development of predictive models, leaving a large degree of uncertainty related to these future changes (Ch. 17: Complex Systems). Models can be used to demonstrate how climate change may impact the production of a given agricultural commodity and/or suggest a change in land use (for example, econometric models, global gridded crop models, and integrated assessment models). However, the true impact may be mitigated by the influence of global economic markets, a shift to a different crop that is better suited to the new climate pattern, technological innovations, policy incentives, or capital improvement projects. This area of integrated, multidisciplinary scientific research is just emerging. Important feedbacks with agriculture are anticipated under changing climate conditions. Recent trends show a shift from dryland farming to irrigated agriculture throughout much of the Great Plains region (Ch. 22: N. Great Plains; Ch. 23: S. Great Plains). 117 Future projections suggest that cropland suitability may increase at higher latitudes 128 and that croplands could shift to livestock grazing southward. 126 For high-latitude regions, climate change could result in a large-scale transformation from naturally vegetated ecosystems to agronomy-dominated systems. Climate warming also could result in a shift from higher-productivity systems (such as irrigated agriculture) to lower-productivity systems (such as dryland farming). 129 Due to the globally interconnected nature of agricultural systems, climate change has broad implications for food security (Ch. 16: International). 130 Energy policies have also influenced the type and location of agricultural activities; for example, nearly two-thirds of recent land area converted for energy use was due to biofuel expansion 34 , 131 mandated by the Energy Independence and Security Act of 2007. 30 , 131 By 2040, the total new land area impacted by energy development could exceed an area the size of Texas—2,700 square miles per year, 34 which is more than two times higher than the historical rate of urbanization. 2 Natural disturbances such as wildfires can trigger changes in land cover that have the potential to result in a permanent land-cover conversion. Over the past several decades, drought, 132 climate warming, and earlier spring snowmelt have led to an increase in fire activity across the United States (Ch. 6: Forests), 18 , 133 although the burnt area increase may be partly due to changes in fire suppression policies. 134 Under future warming scenarios (that is, A1B, as described here), the burnt area in southwestern California could double by 2050 and increase by 35% in the Sierra Nevada due to an increase in the length of the fire season and an increase in warmer and drier days. 135 Human activity will continue to play an important role in wildfire frequency and intensity. Hot spots of fire activity were identified at the wildland–urban interface, 136 and urbanization is expected to increase fire hazard exposure to people and property. Land management strategies, such as prescribed burning, fuel reduction and clearing, invasive species management, and forest thinning, have the potential to mitigate wildland fire and its associated consequences, 137 but more research is needed to evaluate their efficacy across a range of spatial and temporal scales. Current relationships between plant species and climate variables 138 have been used to estimate potential changes in the geographic distribution of species and vegetation under future climate conditions. 12 , 139 , 140 , 141 , 142 , 143 Studies have projected the conversion of forests to shrubland and grassland across some areas of the western United States due to increasing aridity, pest outbreaks, and fire, resulting in a substantial transfer of carbon from the biosphere to the atmosphere. 144 , 145 For example, increases in mountainous forests and grasslands at the expense of alpine and subalpine communities have been projected. 146 Across North America, projected changes include an expansion of tropical dry deciduous forests and desert shrub/scrub biomes, a poleward migration of deciduous and boreal forests, and an expansion of grasslands at the expense of high-latitude taiga and tundra communities. 12 , 144 , 146 , 147 , 148 , 149 However, it is important to note that projecting the future distributions of vegetation and land cover is highly complex, driven not only by changes in climate but also land-use changes, shifts in disturbance regimes, interactions between species, and evolutionary changes. 150
TRACEABLE ACCOUNTS
Process Description
Chapter authors developed the chapter through technical discussions, literature review, and expert deliberation via email and phone discussions. The authors considered feedback from the general public, the National Academies of Sciences, Engineering, and Medicine, and federal agencies. For additional information about the overall process for developing the report, see Appendix 1: Process. The topic of land-use and land-cover change (LULCC) overlaps with numerous other national sectoral chapters (for example, Ch. 6: Forests; Ch. 10: Ag & Rural; Ch. 11: Urban) and is a fundamental characteristic of all regional chapters in this National Climate Assessment. This national sectoral chapter thus focuses on the dynamic interactions between land change and the climate system. The primary focus is to review our current understanding of land change and climate interactions by examining how land change drives changes in local- to global-scale weather and climate and how, in turn, the climate drives changes in land cover and land use through both biophysical and socioeconomic responses. Where possible, the literature cited in this chapter is specific to changes in the United States.
KEY MESSAGES
Key Message 1: Land-Cover Changes Influence Weather and Climate
Changes in land cover continue to impact local- to global-scale weather and climate by altering the flow of energy, water, and greenhouse gases between the land and the atmosphere (high confidence). Reforestation can foster localized cooling (medium confidence), while in urban areas, continued warming is expected to exacerbate urban heat island effects (high confidence).
Description of evidence base
The Land-Use and Climate, IDentification of robust impacts (LUCID) project 88 , 151 evaluated climate response to LULCC using seven coupled land surface models (LSMs) and global climate models (GCMs) to determine effects that were larger than model variability and consistent across all seven models. Results showed significant discrepancies in the effect of LULCC (principally, the conversion of forest to cropland and grassland at temperate and higher latitudes) on near-surface air temperatures; the discrepancies were mainly attributable to the modeling of turbulent flux (sensible heat [the energy required to change temperature] and latent heat [the energy needed to change the phase of a substance, such as from a liquid to a gas]). Land surface models need to be subjected to more rigorous evaluations 151 , 152 and evaluate more than turbulent fluxes and net ecosystem exchange. 152 Rigorous evaluations should extend to the parameterization of albedo, 153 including the effect of canopy density on the albedo of snow-covered land; 154 the seasonal cycle of albedo related to the extent, timing, and persistence of snow; 155 and the benchmarking of the effect of present-day land cover change on albedo. 156 More recently, there is consistent modeling and empirical evidence that forests tend to be cooler than nearby croplands and grasslands. 91 , 92 , 93 , 95 , 96 , 156 The study of the influence of wildland fire on climate is at its advent and lacks a significant knowledge base. 98 , 99 Improved understanding would require more research on the detection of fire characteristics; 157 fire emissions; 158 and the relative roles of greenhouse gas (GHG) emissions, aerosol emissions, and surface albedo changes in climate forcing. 98 The urban heat island (UHI) is perhaps the most unambiguous documentation of anthropogenic modification of climate. 159 Two studies have found that the stunning rate of urbanization in China has led to regional warming, 105 , 106 which is consistent with the observation that land-use and land-cover changes must be extensive for their effects to be realized. 87 Research on the effects of urbanization on precipitation patterns has not produced consistent results. 113 , 114 Uncertainties related to the effect of urban areas on precipitation arise from the interactions among the UHI, increased surface roughness (for example, tall buildings), and increased aerosol concentrations. 160 In general, UHIs produce updrafts that lead to enhanced precipitation either in or downwind of urban areas, whereas urban surface roughness and urban aerosol concentrations can either further contribute to or dampen the updrafts that arise from the UHI. 160
Major uncertainties
Land use and land cover are dynamic; therefore, climate is influenced by a constantly changing land surface. Considerable uncertainties are associated with land-cover and land-use monitoring and projection. 161 , 162 , 163 , 164 Land-cover maps can be derived from remote sensing approaches, but comprehensive approaches are typically characterized by coarse temporal resolution. 2 , 3 , 59 , 60 More recently, remote sensing has enabled annual classification over large areas (national and global), though these efforts have been centered on a single land cover or disturbance type. 68 , 165 , 166 Comprehensive multitemporal mapping of land use is even more limited and is a source of considerable uncertainty in understanding land change and feedbacks with the climate system. Deforestation, urbanization, wildland fire, and irrigated agriculture are the main land-use and land-cover changes that influence climate locally and regionally throughout the United States. Deforestation is likely to behave as a warming agent throughout most of the United States, but higher confidence in this finding would require more research on how to treat sensible and latent heat fluxes in coupled GCM–LSM models; the relationship of albedo to forest density in the presence of snow; the timing, persistence, and extent of snow cover; and real-world comparisons of the response of albedo to land-cover change. Urbanization constitutes a continued expansion of the UHI effect, increasing warming at local scales. Determining the effect of urbanization on precipitation patterns and storm tracks would require extensive, additional research. Tabular irrigation water volume estimates, such as those provided by the U.S. Department of Agriculture’s (USDA) Farm and Ranch Irrigation Survey, must be translated into maps so that the data can be input in GCMs and LSMs to determine the impact of irrigation on climate. Current translation schemes do not provide consistent model output. 124 The effect of wildland fires on climate processes is an emerging issue for which there is little research. Fire releases carbon dioxide (CO2) and other GHGs to the atmosphere, which, along with a decreased albedo, should promote warming. These warming effects, however, may be counterbalanced by the release of aerosols to the atmosphere and enhanced carbon sequestration by forest regrowth. 99
Description of confidence and likelihood
There is medium confidence that deforestation throughout much of the continental United States promotes climate warming through a decrease in carbon sequestration and reduced transpiration. There is low confidence that wildland fires will impact climate, because many of the associated processes and characteristics produce counteracting effects. There is high confidence that urbanization produces local-scale climate change, but there is low confidence in its influence on precipitation patterns. There is high confidence that surface air temperature is reduced near areas of irrigated agriculture and medium confidence that downwind precipitation is increased.
Key Message 2: Climate Impacts on Land and Ecosystems
Climate change affects land use and ecosystems. Climate change is expected to directly and indirectly impact land use and cover by altering disturbance patterns (medium confidence), species distributions (medium confidence), and the suitability of land for specific uses (low confidence). The composition of the natural and human landscapes, and how society uses the land, affects the ability of the Nation’s ecosystems to provide essential goods and services (high confidence).
Description of evidence base
Much of the research assessing the impact of climate change on agriculture has been undertaken as part of the Agricultural Model Intercomparison and Improvement Project (AgMIP), 128 which has been understandably focused on productivity and food security. 128 , 129 , 167 , 168 , 169 Less effort has been devoted to understanding the impact of climate change on the spatial distribution of agriculture. Deryng et al. (2011) 170 used one of the AgMIP crop models (PEGASUS) to show poleward and westward shifts in areas devoted to corn, soybean, and wheat production. Parker and Abatzoglou (2016) 130 have reported a poleward migration of the USDA’s cold hardiness zones as a result of a warming climate. Several empirical studies have found an increase in wildland fires in the western United States over the last several decades, 18 , 101 , 171 in which indicators of aridity correlate positively with the amount of area burned. Several studies have reported a decline in forest cover throughout the western United States and project future declines due to a warming climate and increasing aridity, as well as the concomitant likely increase in pest outbreaks and fire. 144 , 145 , 172 , 173 , 174 Several studies have also reported a poleward shift in the forest communities of the eastern United States, resulting primarily from CO2 enrichment in a warming and wetter environment. 12 , 144 , 147 , 148 , 149 , 175
Major uncertainties
Determining the impact of climate change on agriculture requires the integration of climate, crop, and economic models, 176 each with its own sources of uncertainty that can propagate through the three models. Sources of uncertainty include the response of crops to the intermingled factors of CO2 fertilization, temperature, water, and nitrogen availability; species-specific responses; model parameterization; spatial location of irrigated areas; and other factors. 129 , 169 , 177 The projection of recent empirical fire–climate relationships 18 , 101 , 171 into the future introduces uncertainty, as the empirical results cannot account for future anthropogenic influences (for example, fire suppression management) and vegetation response to future fires. 171 , 178 Similarly, process-based models must account for vegetation response to fire, uncertainty in precipitation predictions from climate models, and spatiotemporal nonuniformity in human interactions with fire and vegetation. 178 Many of the studies on climate-induced spatial migration of vegetation are based on dynamic global vegetation models, which are commonly based only on climate and soil inputs. These models aggregate species characteristics that are not uniform across all species represented and are generally lacking ecological processes that would influence a species’ range shift. 179 , 180 , 181 , 182 , 183 Considerable uncertainties are associated with land-cover and land-use monitoring and projection. 161 , 162 , 163 , 164 Land-cover maps can be derived from remote sensing approaches; however, comprehensive approaches are typically characterized by coarse temporal resolution. 2 , 3 , 59 , 60 More recently, remote sensing has enabled annual classification over large areas (at national and global scales), but these efforts have been centered on a single land cover or disturbance type. 68 , 165 , 166 Comprehensive multitemporal mapping of land use is even more limited and is a source of considerable uncertainty in understanding land change and feedbacks with the climate system.
Description of confidence and likelihood
There is high confidence that climate change will contribute to changes in agricultural land use; however, there is low confidence in the direction and magnitude of change due to uncertainties in the capacity to adapt to climate change. There is high confidence that climate change will impact urbanization in coastal areas, where sea level rise will continue to have direct effects. There is medium confidence that climate change will alter natural disturbance regimes; however, land management activities, such as fire suppression strategies, are likely to be of equal or greater importance. There is low confidence that climate change will result in changes to land cover resulting from changes in species distribution environmental suitability.
REFERENCES
- 2008: Carbon flux to the atmosphere from land-use changes 1850-2005. In TRENDS: A Compendium of Data on Global Change. URL. ↩
- 2015: NACP NAFD Project: Forest Disturbance History from Landsat, 1986–2010. doi:10.3334/ORNLDAAC/1290. ↩
- Abatzoglou, J. T., and A. P. Williams, 2016: Impact of anthropogenic climate change on wildfire across western US forests. Proceedings of the National Academy of Sciences of the United States of America, 113 (42), 11770–11775. doi:10.1073/pnas.1607171113. ↩
- Abramowitz, G., R. Leuning, M. Clark, and A. Pitman, 2008: Evaluating the performance of land surface models. Journal of Climate, 21 (21), 5468–5481. doi:10.1175/2008jcli2378.1. ↩
- Ackerly, D. D., W. K. Cornwell, S. B. Weiss, L. E. Flint, and A. L. Flint, 2015: A geographic mosaic of climate change impacts on terrestrial vegetation: Which areas are most at risk? PLOS ONE, 10 (6), e0130629. doi:10.1371/journal.pone.0130629. ↩
- Ajaaj, A. A., A. K. Mishra, and A. A. Khan, 2017: Urban and peri-urban precipitation and air temperature trends in mega cities of the world using multiple trend analysis methods. Theoretical and Applied Climatology, doi:10.1007/s00704-017-2096-7. ↩
- Alexander, P., R. Prestele, P. H. Verburg, A. Arneth, C. Baranzelli, F. Batista e Silva, C. Brown, A. Butler, K. Calvin, N. Dendoncker, J. C. Doelman, R. Dunford, K. Engström, D. Eitelberg, S. Fujimori, P. A. Harrison, T. Hasegawa, P. Havlik, S. Holzhauer, F. Humpenöder, C. Jacobs-Crisioni, A. K. Jain, T. Krisztin, P. Kyle, C. Lavalle, T. Lenton, J. Liu, P. Meiyappan, A. Popp, T. Powell, R. D. Sands, R. Schaldach, E. Stehfest, J. Steinbuks, A. Tabeau, H. van Meijl, M. A. Wise, and M. D. A. Rounsevell, 2017: Assessing uncertainties in land cover projections. Global Change Biology, 23 (2), 767–781. doi:10.1111/gcb.13447. ↩
- Allen, C. D., A. K. Macalady, H. Chenchouni, D. Bachelet, N. McDowell, M. Vennetier, T. Kitzberger, A. Rigling, D. D. Breshears, E. H. Hogg, P. Gonzalez, R. Fensham, Z. Zhang, J. Castro, N. Demidova, J.-H. Lim, G. Allard, S. W. Running, A. Semerci, and N. Cobb, 2010: A global overview of drought and heat-induced tree mortality reveals emerging climate change risks for forests. Forest Ecology and Management, 259 (4), 660–684. doi:10.1016/j.foreco.2009.09.001. ↩
- Anderson, R. G., J. G. Canadell, J. T. Randerson, R. B. Jackson, B. A. Hungate, D. D. Baldocchi, G. A. Ban-Weiss, G. B. Bonan, K. Caldeira, L. Cao, N. S. Diffenbaugh, K. R. Gurney, L. M. Kueppers, B. E. Law, S. Luyssaert, and T. L. O'Halloran, 2011: Biophysical considerations in forestry for climate protection. Frontiers in Ecology and the Environment, 9 (3), 174–182. doi:10.1890/090179. ↩
- Argüeso, D., J. P. Evans, L. Fita, and K. J. Bormann, 2014: Temperature response to future urbanization and climate change. Climate Dynamics, 42 (7), 2183–2199. doi:10.1007/s00382-013-1789-6. ↩
- Arnfield, A. J., 2003: Two decades of urban climate research: A review of turbulence, exchanges of energy and water, and the urban heat island. International Journal of Climatology, 23 (1), 1–26. doi:10.1002/joc.859. ↩
- Asner, G. P., P. G. Brodrick, C. B. Anderson, N. Vaughn, D. E. Knapp, and R. E. Martin, 2016: Progressive forest canopy water loss during the 2012–2015 California drought. Proceedings of the National Academy of Sciences of the United States of America, 113 (2), E249–E255. doi:10.1073/pnas.1523397113. ↩
- Barnes, C. A., and D. P. Roy, 2008: Radiative forcing over the conterminous United States due to contemporary land cover land use albedo change. Geophysical Research Letters, 35 (9), L09706. doi:10.1029/2008GL033567. ↩
- Bauer, A., R. Farrell, and D. Goldblum, 2016: The geography of forest diversity and community changes under future climate conditions in the eastern United States. Ecoscience, 23 (1), 41–53. doi:10.1080/11956860.2016.1213107. ↩
- Bellassen, V., and S. Luyssaert, 2014: Carbon sequestration: Managing forests in uncertain times. Nature, 503 (7487), 153–155. URL. ↩
- Bentz, B. J., J. Régnière, C. J. Fettig, E. M. Hansen, J. L. Hayes, J. A. Hicke, R. G. Kelsey, J. F. Negrón, and S. J. Seybold, 2010: Climate change and bark beetles of the Western United States and Canada: Direct and indirect effects. BioScience, 60 (8), 602–613. doi:10.1525/Bio.2010.60.8.6. ↩
- Betts, R. A., N. Golding, P. Gonzalez, J. Gornall, R. Kahana, G. Kay, L. Mitchell, and A. Wiltshire, 2015: Climate and land use change impacts on global terrestrial ecosystems and river flows in the HadGEM2-ES Earth system model using the representative concentration pathways. Biogeosciences, 12 (5), 1317–1338. doi:10.5194/bg-12-1317-2015. ↩
- Blake, R., A. Grimm, T. Ichinose, R. Horton, S. Gaffin, S. Jiong, D. Bader, and L. Cecil, 2011: Urban climate: Processes, trends, and projections. Climate Change and Cities: First Assessment Report of the Urban Climate Change Research Network. Rosenzweig, C., W. D. Solecki, S. A. Hammer, and S. Mehrotra, Eds., Cambridge University Press, Cambridge, UK, 43–81. URL. ↩
- Bounoua, L., P. Zhang, G. Mostovoy, K. Thome, J. Masek, M. Imhoff, M. Shepherd, D. Quattrochi, J. Santanello, J. Silva, R. Wolfe, and A. M. Toure, 2015: Impact of urbanization on US surface climate. Environmental Research Letters, 10 (8), 084010. doi:10.1088/1748-9326/10/8/084010. ↩
- Bowman, D. M. J. S., J. K. Balch, P. Artaxo, W. J. Bond, J. M. Carlson, M. A. Cochrane, C. M. D'Antonio, R. S. DeFries, J. C. Doyle, S. P. Harrison, F. H. Johnston, J. E. Keeley, M. A. Krawchuk, C. A. Kull, J. B. Marston, M. A. Moritz, I. C. Prentice, C. I. Roos, A. C. Scott, T. W. Swetnam, G. R. van der Werf, and S. J. Pyne, 2009: Fire in the Earth system. Science, 324 (5926), 481–484. doi:10.1126/science.1163886. ↩
- Brandão, M., A. Levasseur, M. U. F. Kirschbaum, B. P. Weidema, A. L. Cowie, S. V. Jørgensen, M. Z. Hauschild, D. W. Pennington, and K. Chomkhamsri, 2013: Key issues and options in accounting for carbon sequestration and temporary storage in life cycle assessment and carbon footprinting. International Journal of Life Cycle Assessment, 18 (1), 230–240. doi:10.1007/s11367-012-0451-6. ↩
- Brown, J. F., and M. S. Pervez, 2014: Merging remote sensing data and national agricultural statistics to model change in irrigated agriculture. Agricultural Systems, 127, 28–40. doi:10.1016/j.agsy.2014.01.004. ↩
- Cheaib, A., V. Badeau, J. Boe, I. Chuine, C. Delire, E. Dufrêne, C. François, E. S. Gritti, M. Legay, and C. Pagé, 2012: Climate change impacts on tree ranges: Model intercomparison facilitates understanding and quantification of uncertainty. Ecology Letters, 15 (6), 533–544. doi:10.1111/j.1461-0248.2012.01764.x. ↩
- Cohen, J. D., 2000: Preventing disaster: Home ignitability in the wildland-urban interface. Journal of Forestry, 98 (3), 15–21. doi:10.1093/jof/98.3.15. ↩
- Congalton, R. G., J. Gu, K. Yadav, P. Thenkabail, and M. Ozdogan, 2014: Global land cover mapping: A review and uncertainty analysis. Remote Sensing, 6 (12), 12070–12093. doi:10.3390/rs61212070. ↩
- Cotton, W. R., and R. A. Pielke Sr., 2007: Human Impacts on Weather and Climate. Cambridge University Press, Cambridge; New York, doi:10.1017/CBO9780511808319. ↩
- Crossett, K., B. Ache, P. Pacheco, and K. Haber, 2013: National Coastal Population Report: Population Trends from 1970 to 2020. NOAA Office for Coastal Management, Silver Spring, MD, 19 pp. URL. ↩
- Daehler, C. C., 2003: Performance comparisons of co-occurring native and alien invasive plants: Implications for conservation and restoration. Annual Review of Ecology, Evolution, and Systematics, 34 (1), 183–211. doi:10.1146/annurev.ecolsys.34.011802.132403. ↩
- Dale, V. H., 1997: The relationship between land‐use change and climate change. Ecological Applications, 7 (3), 753–769. doi:10.1890/1051-0761(1997)007[0753:TRBLUC]2.0.CO;2. ↩
- Daniels, J. M., 2005: The rise and fall of the Pacific Northwest log export market. General Technical Report PNW-GTR-624. USDA, Pacific Northwest Research Station, Portland, OR, 80 pp. URL. ↩
- Davidson, A., and S. Wang, 2004: The effects of sampling resolution on the surface albedos of dominant land cover types in the North American boreal region. Remote Sensing of Environment, 93 (1), 211–224. doi:10.1016/j.rse.2004.07.005. ↩
- de Noblet-Ducoudré, N., J.-P. Boisier, A. Pitman, G. B. Bonan, V. Brovkin, F. Cruz, C. Delire, V. Gayler, B. J. J. M. van den Hurk, P. J. Lawrence, M. K. van der Molen, C. Müller, C. H. Reick, B. J. Strengers, and A. Voldoire, 2012: Determining robust impacts of land-use-induced land cover changes on surface climate over North America and Eurasia: Results from the first set of LUCID experiments. Journal of Climate, 25 (9), 3261–3281. doi:10.1175/JCLI-D-11-00338.1. ↩
- DeAngelis, A., F. Dominguez, Y. Fan, A. Robock, M. D. Kustu, and D. Robinson, 2010: Evidence of enhanced precipitation due to irrigation over the Great Plains of the United States. Journal of Geophysical Research, 115, D15115. doi:10.1029/2010JD013892. ↩
- Deryng, D., W. J. Sacks, C. C. Barford, and N. Ramankutty, 2011: Simulating the effects of climate and agricultural management practices on global crop yield. Global Biogeochemical Cycles, 25 (2), GB2006. doi:10.1029/2009GB003765. ↩
- Diffenbaugh, N. S., 2009: Influence of modern land cover on the climate of the United States. Climate Dynamics, 33 (7–8), 945–958. doi:10.1007/s00382-009-0566-z. ↩
- Drummond, M. A., 2007: Regional dynamics of grassland change in the western Great Plains. Great Plains Research, 17, 133–144. URL. ↩
- Drummond, M. A., R. F. Auch, K. A. Karstensen, K. L. Sayler, J. L. Taylor, and T. R. Loveland, 2012: Land change variability and human–environment dynamics in the United States Great Plains. Land Use Policy, 29 (3), 710–723. doi:10.1016/j.landusepol.2011.11.007. ↩
- Eidenshink, J., B. Schwind, K. Brewer, Z. Zhu, B. Quayle, and S. Howard, 2007: A project for monitoring trends in burn severity. Fire Ecology, 3 (1), 3–21. URL. ↩
- Elliott, J., D. Deryng, C. Muller, K. Frieler, M. Konzmann, D. Gerten, M. Glotter, M. Florke, Y. Wada, N. Best, S. Eisner, B. M. Fekete, C. Folberth, I. Foster, S. N. Gosling, I. Haddeland, N. Khabarov, F. Ludwig, Y. Masaki, S. Olin, C. Rosenzweig, A. C. Ruane, Y. Satoh, E. Schmid, T. Stacke, Q. Tang, and D. Wisser, 2014: Constraints and potentials of future irrigation water availability on agricultural production under climate change. Proceedings of the National Academy of Sciences of the United States of America, 111 (9), 3239–3244. doi:10.1073/pnas.1222474110. ↩
- Energy Independence and Security Act of 2007. Pub. L. No. 110-140, 121 Stat 1492, December 19 2007. URL. ↩
- EPA, 2017: Inventory of U.S. Greenhouse Gas Emissions and Sinks: 1990-2015. EPA 430-P-17-001. U.S. Environmental Protection Agency, Washington, D.C., 633 pp. URL. ↩
- EPA, 2017: Updates to the Demographic and Spatial Allocation Models to Produce Integrated Climate and Land Use Scenarios (ICLUS) Version 2. EPA/600/R-16/366F. U.S. Environmental Protection Agency, National Center for Environmental Assessment, Washington, DC, various pp. URL. ↩
- Flannigan, M., B. Stocks, M. Turetsky, and M. Wotton, 2009: Impacts of climate change on fire activity and fire management in the circumboreal forest. Global Change Biology, 15 (3), 549–560. doi:10.1111/j.1365-2486.2008.01660.x. ↩
- Foley, J. A., N. Ramankutty, K. A. Brauman, E. S. Cassidy, J. S. Gerber, M. Johnston, N. D. Mueller, C. O'Connell, D. K. Ray, P. C. West, C. Balzer, E. M. Bennett, S. R. Carpenter, J. Hill, C. Monfreda, S. Polasky, J. Rockstrom, J. Sheehan, S. Siebert, D. Tilman, and D. P. M. Zaks, 2011: Solutions for a cultivated planet. Nature, 478 (7369), 337–342. doi:10.1038/nature10452. ↩
- Food Security Act of 1985. Pub. L. No. 99-198, 99 Stat 1504, December 23 1985. URL. ↩
- Forest Service and Bureau of Land Management, 1994: Record of decision for: Amendments to Forest Service and Bureau of Land Management planning documents within the range of the northern spotted owl ; and, Standards and guidelines for management of habitat for late-successional and old-growth forest related species within the range of the northern spotted owl. USDA, Forest Service; U.S. Dept. of Interior, Bureau of Land Management, Washington, DC, various pp. URL. ↩
- Forkel, M., N. Carvalhais, C. Rödenbeck, R. Keeling, M. Heimann, K. Thonicke, S. Zaehle, and M. Reichstein, 2016: Enhanced seasonal CO2 exchange caused by amplified plant productivity in northern ecosystems. Science, 351 (6274), 696–699. doi:10.1126/science.aac4971. ↩
- Friedl, M. A., J. M. Gray, E. K. Melaas, A. D. Richardson, K. Hufkens, T. F. Keenan, A. Bailey, and J. O'Keefe, 2014: A tale of two springs: Using recent climate anomalies to characterize the sensitivity of temperate forest phenology to climate change. Environmental Research Letters, 9 (5), 054006. doi:10.1088/1748-9326/9/5/054006. ↩
- Fry, J. A., G. Xian, S. Jin, J. A. Dewitz, C. G. Homer, Y. Limin, C. A. Barnes, N. D. Herold, and J. D. Wickham, 2011: Completion of the 2006 national land cover database for the conterminous United States. Photogrammetric Engineering & Remote Sensing, 77 (9), 858–864. . ↩
- Gelfand, I., R. Sahajpal, X. Zhang, R. C. Izaurralde, K. L. Gross, and G. P. Robertson, 2013: Sustainable bioenergy production from marginal lands in the US Midwest. Nature, 493 (7433), 514–517. doi:10.1038/nature11811. ↩
- Gerrard, M. B., and E. McTiernan, 2017: New York's new sea level rise projections will affect land use, infrastructure. New York Law Journal, 257 (45), 3. URL. ↩
- Gonzalez, P., R. P. Neilson, J. M. Lenihan, and R. J. Drapek, 2010: Global patterns in the vulnerability of ecosystems to vegetation shifts due to climate change. Global Ecology and Biogeography, 19 (6), 755–768. doi:10.1111/j.1466-8238.2010.00558.x. ↩
- Gordon, L. J., W. Steffen, B. F. Jönsson, C. Folke, M. Falkenmark, and Å. Johannessen, 2005: Human modification of global water vapor flows from the land surface. Proceedings of the National Academy of Sciences of the United States of America, 102 (21), 7612–7617. doi:10.1016/j.landusepol.2011.11.007. ↩
- Hale, R. C., K. P. Gallo, T. W. Owen, and T. R. Loveland, 2006: Land use/land cover change effects on temperature trends at U.S. Climate Normals stations. Geophysical Research Letters, 33 (11), L11703. doi:10.1029/2006gl026358. ↩
- Halofsky, J. E., M. A. Hemstrom, D. R. Conklin, J. S. Halofsky, B. K. Kerns, and D. Bachelet, 2013: Assessing potential climate change effects on vegetation using a linked model approach. Ecological Modelling, 266, 131–143. doi:10.1016/j.ecolmodel.2013.07.003. ↩
- Hamdi, R., P. Termonia, and P. Baguis, 2011: Effects of urbanization and climate change on surface runoff of the Brussels Capital Region: A case study using an urban soil–vegetation–atmosphere‐transfer model. International Journal of Climatology, 31 (13), 1959–1974. doi:10.1002/joc.2207. ↩
- Han, J.-Y., J.-J. Baik, and H. Lee, 2014: Urban impacts on precipitation. Asia-Pacific Journal of Atmospheric Sciences, 50 (1), 17–30. doi:10.1007/s13143-014-0016-7. ↩
- Hansen, M. C., P. V. Potapov, R. Moore, M. Hancher, S. A. Turubanova, A. Tyukavina, D. Thau, S. V. Stehman, S. J. Goetz, T. R. Loveland, A. Kommareddy, A. Egorov, L. Chini, C. O. Justice, and J. R. G. Townshend, 2013: High-resolution global maps of 21st-century forest cover change. Science, 342 (6160), 850–853. doi:10.1126/science.1244693. ↩
- Hao, W. M., and N. K. Larkin, 2014: Wildland fire emissions, carbon, and climate: Wildland fire detection and burned area in the United States. Forest Ecology and Management, 317, 20–25. doi:10.1016/j.foreco.2013.09.029. ↩
- Harrison, S. P., J. R. Marlon, and P. J. Bartlein, 2010: Fire in the Earth system. Changing Climates, Earth Systems and Society. Dodson, J., Ed., Springer, Dordrecht, 21–48. doi:10.1007/978-90-481-8716-4_3. ↩
- Hartmann, D. L., A. M. G. Klein Tank, M. Rusticucci, L. V. Alexander, S. Brönnimann, Y. Charabi, F. J. Dentener, E. J. Dlugokencky, D. R. Easterling, A. Kaplan, B. J. Soden, P. W. Thorne, M. Wild, and P. M. Zhai, 2013: Observations: Atmosphere and surface. Climate Change 2013: The Physical Science Basis. Contribution of Working Group I to the Fifth Assessment Report of the Intergovernmental Panel on Climate Change. Stocker, T. F., D. Qin, G.-K. Plattner, M. Tignor, S. K. Allen, J. Boschung, A. Nauels, Y. Xia, V. Bex, and P. M. Midgley, Eds., Cambridge University Press, Cambridge, United Kingdom and New York, NY, USA, 159–254. URL. ↩
- Hauer, M. E., J. M. Evans, and D. R. Mishra, 2016: Millions projected to be at risk from sea-level rise in the continental United States. Nature Climate Change, 6 (7), 691–695. doi:10.1038/nclimate2961. ↩
- Hawbaker, T. J., V. C. Radeloff, R. B. Hammer, and M. K. Clayton, 2005: Road density and landscape pattern in relation to housing density, and ownership, land cover, and soils. Landscape ecology, 20 (5), 609–625. doi:10.1007/s10980-004-5647-0. ↩
- Hibbard, K. A., F. M. Hoffman, D. Huntzinger, and T. O. West, 2017: Changes in Land Cover and Terrestrial Biogeochemistry. Climate Science Special Report: Fourth National Climate Assessment, Volume I. Wuebbles, D. J., D. W. Fahey, K. A. Hibbard, D. J. Dokken, B. C. Stewart, and T. K. Maycock, Eds., U.S. Global Change Research Program, Washington, DC, USA, 277–302. doi:10.7930/J0416V6X. ↩
- Higuera, P. E., J. T. Abatzoglou, J. S. Littell, and P. Morgan, 2015: The changing strength and nature of fire-climate relationships in the northern Rocky Mountains, U.S.A., 1902-2008. PLoS ONE, 10 (6), e0127563. doi:10.1371/journal.pone.0127563. ↩
- Hinkel, J., D. Lincke, A. T. Vafeidis, M. Perrette, R. J. Nicholls, R. S. Tol, B. Marzeion, X. Fettweis, C. Ionescu, and A. Levermann, 2014: Coastal flood damage and adaptation costs under 21st century sea-level rise. Proceedings of the National Academy of Sciences of the United States of America, 111 (9), 3292–3297. doi:10.1073/pnas.1222469111. ↩
- Homer, C. G., J. A. Dewitz, L. Yang, S. Jin, P. Danielson, G. Xian, J. Coulston, N. D. Herold, J. Wickham, and K. Megown, 2015: Completion of the 2011 National Land Cover Database for the conterminous United States—Representing a decade of land cover change information. Photogrammetric Engineering & Remote Sensing, 81 (5), 345–354. doi:10.14358/PERS.81.5.345. ↩
- Homer, C., C. Huang, L. Yang, B. Wylie, and M. Coan, 2007: Development of a 2001 National Land-Cover Database for the United States. Photogrammetric Engineering & Remote Sensing, 70 (7), 829–840. doi:10.14358/PERS.70.7.829. ↩
- Houghton, R. A., J. L. Hackler, and K. T. Lawrence, 1999: The U.S. carbon budget: Contributions from land-use change. Science, 285 (5427), 574–578. doi:10.1126/science.285.5427.574. ↩
- Huong, H. T. L., and A. Pathirana, 2013: Urbanization and climate change impacts on future urban flooding in Can Tho City, Vietnam. Hydrology Earth System Sciences, 17 (1), 379–394. doi:10.5194/hess-17-379-2013. ↩
- Hurteau, M. D., J. B. Bradford, P. Z. Fulé, A. H. Taylor, and K. L. Martin, 2014: Climate change, fire management, and ecological services in the southwestern US. Forest Ecology and Management, 327, 280–289. doi:10.1016/j.foreco.2013.08.007. ↩
- Hurtt, G. C., L. P. Chini, S. Frolking, R. A. Betts, J. Feddema, G. Fischer, J. P. Fisk, K. Hibbard, R. A. Houghton, A. Janetos, C. D. Jones, G. Kindermann, T. Kinoshita, K. Klein Goldewijk, K. Riahi, E. Shevliakova, S. Smith, E. Stehfest, A. Thomson, P. Thornton, D. P. van Vuuren, and Y. P. Wang, 2011: Harmonization of land-use scenarios for the period 1500–2100: 600 years of global gridded annual land-use transitions, wood harvest, and resulting secondary lands. Climatic Change, 109 (1), 117. doi:10.1007/s10584-011-0153-2. ↩
- IPCC, 2014: Climate Change 2014: Synthesis Report. Contribution of Working Groups I, II and III to the Fifth Assessment Report of the Intergovernmental Panel on Climate Change. Intergovernmental Panel on Climate Change (IPCC), Geneva, Switzerland, 151 pp. URL. ↩
- Iverson, L. R., A. M. Prasad, S. N. Matthews, and M. Peters, 2008: Estimating potential habitat for 134 eastern US tree species under six climate scenarios. Forest Ecology and Management, 254 (3), 390–406. doi:10.1016/j.foreco.2007.07.023. ↩
- Jankovic, V., and M. Hebbert, 2012: Hidden climate change—Urban meteorology and the scales of real weather. Climatic Change, 113 (1), 23–33. doi:10.1007/s10584-012-0429-1. ↩
- Jiang, X., S. A. Rauscher, T. D. Ringler, D. M. Lawrence, A. P. Williams, C. D. Allen, A. L. Steiner, D. M. Cai, and N. G. McDowell, 2013: Projected future changes in vegetation in western North America in the twenty-first century. Journal of Climate, 26 (11), 3671–3687. doi:10.1175/jcli-d-12-00430.1. ↩
- Jolly, W. M., M. A. Cochrane, P. H. Freeborn, Z. A. Holden, T. J. Brown, G. J. Williamson, and D. M. J. S. Bowman, 2015: Climate-induced variations in global wildfire danger from 1979 to 2013. Nature Communications, 6, 7537. doi:10.1038/ncomms8537. ↩
- Kalnay, E., and M. Cai, 2003: Impact of urbanization and land-use change on climate. Nature, 423 (6939), 528–531. doi:10.1038/nature01675. ↩
- Keeley, J., and A. Syphard, 2016: Climate change and future fire regimes: Examples from California. Geosciences, 6 (3), 37. doi:10.3390/geosciences6030037. ↩
- Kirwan, M. L., and J. P. Megonigal, 2013: Tidal wetland stability in the face of human impacts and sea-level rise. Nature, 504 (7478), 53–60. doi:10.1038/nature12856. ↩
- Kriegler, E., J. Edmonds, S. Hallegatte, K. L. Ebi, T. Kram, K. Riahi, H. Winkler, and D. P. van Vuuren, 2014: A new scenario framework for climate change research: The concept of shared climate policy assumptions. Climatic Change, 122 (3), 401–414. doi:10.1007/s10584-013-0971-5. ↩
- Kulmatiski, A., and K. H. Beard, 2013: Woody plant encroachment facilitated by increased precipitation intensity. Nature Climate Change, 3 (9), 833–837. doi:10.1038/nclimate1904. ↩
- Kuppinger, D. M., M. A. Jenkins, and P. S. White, 2010: Predicting the post-fire establishment and persistence of an invasive tree species across a complex landscape. Biological Invasions, 12 (10), 3473–3484. doi:10.1007/s10530-010-9745-4. ↩
- Kurz, W. A., C. C. Dymond, G. Stinson, G. J. Rampley, E. T. Neilson, A. L. Carroll, T. Ebata, and L. Safranyik, 2008: Mountain pine beetle and forest carbon feedback to climate change. Nature, 452 (7190), 987–990. doi:10.1038/nature06777. ↩
- Lambin, E. F., and P. Meyfroidt, 2011: Global land use change, economic globalization, and the looming land scarcity. Proceedings of the National Academy of Sciences of the United States of America, 108 (9), 3465–3472. doi:10.1073/pnas.1100480108. ↩
- Lambin, E. F., B. L. Turner, H. J. Geist, S. B. Agbola, A. Angelsen, J. W. Bruce, O. T. Coomes, R. Dirzo, G. Fischer, C. Folke, P.S.George, K. Homewood, J. Imbernon, R. Leemans, X. Li, E. F. Moran, M. Mortimore, P. S. Ramakrishnan, J. F. Richards, H. Skånes, W. Steffen, G. D. Stone, U. Svedin, T. A. Veldkamp, C. Vogel, and J. Xu, 2001: The causes of land-use and land-cover change: Moving beyond the myths. Global Environmental Change, 11 (4), 261–269. doi:10.1016/S0959-3780(01)00007-3. ↩
- Lawrence, P. J., and T. N. Chase, 2007: Representing a new MODIS consistent land surface in the Community Land Model (CLM 3.0). Journal of Geophysical Research, 112 (G1), G01023. doi:10.1029/2006JG000168. ↩
- Leng, G., M. Huang, Q. Tang, W. J. Sacks, H. Lei, and L. R. Leung, 2013: Modeling the effects of irrigation on land surface fluxes and states over the conterminous United States: Sensitivity to input data and model parameters. Journal of Geophysical Research Atmospheres, 118 (17), 9789–9803. doi:10.1002/jgrd.50792. ↩
- Li, Y., M. Zhao, S. Motesharrei, Q. Mu, E. Kalnay, and S. Li, 2015: Local cooling and warming effects of forests based on satellite observations. Nature communications, 6, 6603. doi:10.1038/ncomms7603. ↩
- Lobell, D. B. F., Christopher B., 2007: Global scale climate - Crop yield relationships and the impacts of recent warming. Environmental Research Letters, 2 (1) doi:10.1088/1748-9326/2/1/014002. ↩
- Lobell, D., G. Bala, A. Mirin, T. Phillips, R. Maxwell, and D. Rotman, 2009: Regional differences in the influence of irrigation on climate. Journal of Climate, 22 (8), 2248–2255. doi:10.1175/2008JCLI2703.1. ↩
- Loehman, R. A., E. Reinhardt, and K. L. Riley, 2014: Wildland fire emissions, carbon, and climate: Seeing the forest and the trees—A cross-scale assessment of wildfire and carbon dynamics in fire-prone, forested ecosystems. Forest Ecology and Management, 317, 9–19. doi:10.1016/j.foreco.2013.04.014. ↩
- Lutz, J. A., J. W. van Wagtendonk, and J. F. Franklin, 2010: Climatic water deficit, tree species ranges, and climate change in Yosemite National Park. Journal of Biogeography, 37 (5), 936–950. doi:10.1111/j.1365-2699.2009.02268.x. ↩
- Mahmood, R., R. A. Pielke, K. G. Hubbard, D. Niyogi, P. A. Dirmeyer, C. McAlpine, A. M. Carleton, R. Hale, S. Gameda, A. Beltrán-Przekurat, B. Baker, R. McNider, D. R. Legates, M. Shepherd, J. Du, P. D. Blanken, O. W. Frauenfeld, U. S. Nair, and S. Fall, 2014: Land cover changes and their biogeophysical effects on climate. International Journal of Climatology, 34, 929–953. doi:10.1002/joc.3736. ↩
- Markell, D. L., 2016: Emerging legal and institutional responses to sea-level rise in Florida and beyond. Columbia Journal of Environmental Law, 42 (1), 1–58. URL. ↩
- Marshall, C. H., R. A. Pielke Sr., L. T. Steyaert, and D. A. Willard, 2004: The impact of anthropogenic land-cover change on the Florida peninsula sea breezes and warm season sensible weather. Monthly Weather Review, 132 (1), 28–52. doi:2.0.CO;2'>10.1175/1520-0493(2004)132 2.0.CO;2. ↩
- Masui, T., K. Matsumoto, Y. Hijioka, T. Kinoshita, T. Nozawa, S. Ishiwatari, E. Kato, P. R. Shukla, Y. Yamagata, and M. Kainuma, 2011: An emission pathway for stabilization at 6 Wm −2 radiative forcing. Climatic Change, 109 (1), 59–76. doi:10.1007/s10584-011-0150-5. ↩
- McGrath, J. M., and D. B. Lobell, 2013: Regional disparities in the CO2 fertilization effect and implications for crop yields. Environmental Research Letters, 8 (1), 014054. doi:10.1088/1748-9326/8/1/014054. ↩
- Melillo, J. M., J. M. Reilly, D. W. Kicklighter, A. C. Gurgel, T. W. Cronin, S. Paltsev, B. S. Felzer, X. Wang, A. P. Sokolov, and C. A. Schlosser, 2009: Indirect emissions from biofuels: How important? Science, 326 (5958), 1397–1399. doi:10.1126/science.1180251. ↩
- Melton, F., C. Rosevelt, A. Guzman, L. Johnson, I. Zaragoza, J. Verdin, P. Thenkabail, C. Wallace, R. Mueller, P. Willis, and J. Jones, 2015: Fallowed area mapping for drought impact reporting: 2015 assessment of conditions in the California Central Valley. NASA Ames Research Center, 13 pp. URL. ↩
- Meyfroidt, P., E. F. Lambin, K.-H. Erb, and T. W. Hertel, 2013: Globalization of land use: Distant drivers of land change and geographic displacement of land use. Current Opinion in Environmental Sustainability, 5 (5), 438–444. doi:10.1016/j.cosust.2013.04.003. ↩
- Mildrexler, D. J., M. Zhao, and S. W. Running, 2011: A global comparison between station air temperatures and MODIS land surface temperatures reveals the cooling role of forests. Journal of Geophysical Research, 116 (G3), G03025. doi:10.1029/2010JG001486. ↩
- Montenegro, A., M. Eby, Q. Mu, M. Mulligan, A. J. Weaver, E. C. Wiebe, and M. Zhao, 2009: The net carbon drawdown of small scale afforestation from satellite observations. Global and Planetary Change, 69 (4), 195–204. doi:10.1016/j.gloplacha.2009.08.005. ↩
- Moss, R. H., J. A. Edmonds, K. A. Hibbard, M. R. Manning, S. K. Rose, D. P. van Vuuren, T. R. Carter, S. Emori, M. Kainuma, T. Kram, G. A. Meehl, J. F. B. Mitchell, N. Nakicenovic, K. Riahi, S. J. Smith, R. J. Stouffer, A. M. Thomson, J. P. Weyant, and T. J. Wilbanks, 2010: The next generation of scenarios for climate change research and assessment. Nature, 463, 747–756. doi:10.1038/nature08823. ↩
- Mu, J. E., B. M. Sleeter, J. T. Abatzoglou, and J. M. Antle, 2017: Climate impacts on agricultural land use in the United States: The role of socio-economic scenarios. Climatic Change, 144 (2), 329–345. doi:10.1007/s10584-017-2033-x. ↩
- National Agricultural Statistics Service, 2014: 2012 Census of Agriculture: 2013 Farm and Ranch Irrigation Survey. AC-12-SS-1. U.S. Department of Agriculture, 249 pp. URL. ↩
- Nelson, G. C., D. Mensbrugghe, H. Ahammad, E. Blanc, K. Calvin, T. Hasegawa, P. Havlik, E. Heyhoe, P. Kyle, H. Lotze‐Campen, M. von Lampe, D. Mason d'Croz, H. van Meijl, C. Müller, J. Reilly, R. Robertson, R. D. Sands, C. Schmitz, A. Tabeau, K. Takahashi, H. Valin, and D. Willenbockel, 2014: Agriculture and climate change in global scenarios: Why don't the models agree. Agricultural Economics, 45 (1), 85–101. doi:10.1111/agec.12091. ↩
- Nelson, G. C., H. Valin, R. D. Sands, P. Havlík, H. Ahammad, D. Deryng, J. Elliott, S. Fujimori, T. Hasegawa, E. Heyhoe, P. Kyle, M. V. Lampe, H. Lotze-Campen, D. M. d'Croz, H. van Meijl, D. van der Mensbrugghe, C. Müller, A. Popp, R. Robertson, S. Robinson, E. Schmid, C. Schmitz, A. Tabeau, and D. Willenbockelo, 2014: Climate change effects on agriculture: Economic responses to biophysical shocks. Proceedings of the National Academy of Sciences of the United States of America, 111 (9), 3274–3279. doi:10.1073/pnas.1222465110. ↩
- Notaro, M., A. Mauss, and J. W. Williams, 2012: Projected vegetation changes for the American Southwest: Combined dynamic modeling and bioclimatic‐envelope approach. Ecological Applications, 22 (4), 1365–1388. doi:10.1890/11-1269.1. ↩
- O'Neill, B. C., E. Kriegler, K. Riahi, K. L. Ebi, S. Hallegatte, T. R. Carter, R. Mathur, and D. P. van Vuuren, 2014: A new scenario framework for climate change research: The concept of shared socioeconomic pathways. Climatic Change, 122 (3), 387–400. doi:10.1007/s10584-013-0905-2. ↩
- Office for Coastal Management, 2018: C-CAP FTP Tool: An interface for downloading land cover data. NOAA National Ocean Service, Silver Spring, MD. URL. ↩
- Oleson, K. W., A. Monaghan, O. Wilhelmi, M. Barlage, N. Brunsell, J. Feddema, L. Hu, and D. F. Steinhoff, 2015: Interactions between urbanization, heat stress, and climate change. Climatic Change, 129 (3–4), 525–541. doi:10.1007/s10584-013-0936-8. ↩
- Park, C.-E., S.-J. Jeong, C.-H. Ho, and J. Kim, 2015: Regional variations in potential plant habitat changes in response to multiple global warming scenarios. Journal of Climate, 28 (7), 2884–2899. doi:10.1175/JCLI-D-13-00753.1. ↩
- Park, T., S. Ganguly, H. Tømmervik, E. S. Euskirchen, K.-A. Høgda, S. R. Karlsen, V. Brovkin, R. R. Nemani, and R. B. Myneni, 2016: Changes in growing season duration and productivity of northern vegetation inferred from long-term remote sensing data. Environmental Research Letters, 11 (8), 084001. doi:10.1088/1748-9326/11/8/084001. ↩
- Parker, L. E., and J. T. Abatzoglou, 2016: Projected changes in cold hardiness zones and suitable overwinter ranges of perennial crops over the United States. Environmental Research Letters, 11 (3), 034001. doi:10.1088/1748-9326/11/3/034001. ↩
- Paustian, K., J. Lehmann, S. Ogle, D. Reay, G. P. Robertson, and P. Smith, 2016: Climate-smart soils. Nature, 532, 49–57. doi:10.1038/nature17174. ↩
- Pearson, R. G., and T. P. Dawson, 2003: Predicting the impacts of climate change on the distribution of species: Are bioclimate envelope models useful? Global Ecology and Biogeography, 12 (5), 361–371. doi:10.1046/j.1466-822X.2003.00042.x. ↩
- Pielke Sr., R. A., A. Pitman, D. Niyogi, R. Mahmood, C. McAlpine, F. Hossain, K. K. Goldewijk, U. Nair, R. Betts, S. Fall, M. Reichstein, P. Kabat, and N. de Noblet, 2011: Land use/land cover changes and climate: Modeling analysis and observational evidence. Wiley Interdisciplinary Reviews: Climate Change, 2 (6), 828–850. doi:10.1002/wcc.144. ↩
- Pielke, R. A., Sr., 2005: Land use and climate change. Science, 310 (5754), 1625–1626. doi:10.1126/science.1120529. ↩
- Pielke, R. A., Sr., J. Adegoke, A. BeltráN-Przekurat, C. A. Hiemstra, J. Lin, U. S. Nair, D. Niyogi, and T. E. Nobis, 2007: An overview of regional land-use and land-cover impacts on rainfall. Tellus B, 59 (3), 587–601. doi:10.1111/j.1600-0889.2007.00251.x. ↩
- Pitman, A. J., F. B. Avila, G. Abramowitz, Y. P. Wang, S. J. Phipps, and N. de Noblet-Ducoudré, 2011: Importance of background climate in determining impact of land-cover change on regional climate. Nature Climate Change, 1 (9), 472–475. doi:10.1038/nclimate1294. ↩
- Plevin, R. J., M. O'Hare, A. D. Jones, M. S. Torn, and H. K. Gibbs, 2010: Greenhouse gas emissions from biofuels' indirect land use change are uncertain but may be much greater than previously estimated. Environmental Science & Technology, 44 (21), 8015–8021. doi:10.1021/es101946t. ↩
- Radeloff, V. C., R. B. Hammer, S. I. Stewart, J. S. Fried, S. S. Holcomb, and J. F. McKeefry, 2005: The wildland-urban interface in the United States. Ecological Applications, 15 (3), 799–805. doi:10.1890/04-1413. ↩
- Rehfeldt, G. E., N. L. Crookston, C. Sáenz-Romero, and E. M. Campbell, 2012: North American vegetation model for land-use planning in a changing climate: A solution to large classification problems. Ecological Applications, 22 (1), 119–141. doi:10.1890/11-0495.1. ↩
- Rehfeldt, G. E., N. L. Crookston, M. V. Warwell, and J. S. Evans, 2006: Empirical analyses of plant-climate relationships for the western United States. International Journal of Plant Sciences, 167 (6), 1123–1150. . ↩
- Renwick, K. M., and M. E. Rocca, 2015: Temporal context affects the observed rate of climate‐driven range shifts in tree species. Global Ecology and Biogeography, 24 (1), 44–51. doi:10.1111/geb.12240. ↩
- Revi, A., D. E. Satterthwaite, F. Aragón-Durand, J. Corfee-Morlot, R. B. R. Kiunsi, M. Pelling, D. C. Roberts, and W. Solecki, 2014: Urban areas. Climate Change 2014: Impacts, Adaptation, and Vulnerability. Part A: Global and Sectoral Aspects. Contribution of Working Group II to the Fifth Assessment Report of the Intergovernmental Panel of Climate Change. Field, C. B., V. R. Barros, D. J. Dokken, K. J. Mach, M. D. Mastrandrea, T. E. Bilir, M. Chatterjee, K. L. Ebi, Y. O. Estrada, R. C. Genova, B. Girma, E. S. Kissel, A. N. Levy, S. MacCracken, P. R. Mastrandrea, and L. L. White, Eds., Cambridge University Press, Cambridge, United Kingdom and New York, NY, USA, 535–612. ↩
- Riahi, K., S. Rao, V. Krey, C. Cho, V. Chirkov, G. Fischer, G. Kindermann, N. Nakicenovic, and P. Rafaj, 2011: RCP 8.5—A scenario of comparatively high greenhouse gas emissions. Climatic Change, 109 (1–2), 33–57. doi:10.1007/s10584-011-0149-y. ↩
- Rosenzweig, C., J. Elliott, D. Deryng, A. C. Ruane, C. Müller, A. Arneth, K. J. Boote, C. Folberth, M. Glotter, N. Khabarov, K. Neumann, F. Piontek, T. A. M. Pugh, E. Schmid, E. Stehfest, H. Yang, and J. W. Jones, 2014: Assessing agricultural risks of climate change in the 21st century in a global gridded crop model intercomparison. Proceedings of the National Academy of Sciences of the United States of America, 111 (9), 3268–3273. doi:10.1073/pnas.1222463110. ↩
- Rosenzweig, C., J. W. Jones, J. Antle, jerry Hatfield, A. Ruane, S. McDermid, K. Boote, P. Thorburn, K. Descheemaeker, R. Valdivia, C. Porter, S. Janssen, W.-L. Bartels, A. Sullivan, and C. Mutter, 2016: Protocols for AgMIP Regional Integrated Assessments, Version 6.1. Agricultural Model Intercomparison and Improvement Project (AgMIP), New York, NY, 65 pp. URL. ↩
- Ryals, R., M. Kaiser, M. S. Torn, A. A. Berhe, and W. L. Silver, 2014: Impacts of organic matter amendments on carbon and nitrogen dynamics in grassland soils. Soil Biology and Biochemistry, 68, 52–61. doi:10.1016/j.soilbio.2013.09.011. ↩
- Sacks, W. J., B. I. Cook, N. Buenning, S. Levis, and J. H. Helkowski, 2009: Effects of global irrigation on the near-surface climate. Climate Dynamics, 33 (2–3), 159–175. doi:10.1007/s00382-008-0445-z. ↩
- Salazar, A., G. Baldi, M. Hirota, J. Syktus, and C. McAlpine, 2015: Land use and land cover change impacts on the regional climate of non-Amazonian South America: A review. Global and Planetary Change, 128, 103–119. doi:10.1016/j.gloplacha.2015.02.009. ↩
- Scheiter, S., L. Langan, and S. I. Higgins, 2013: Next‐generation dynamic global vegetation models: Learning from community ecology. New Phytologist, 198 (3), 957–969. doi:10.1111/nph.12210. ↩
- Schoennagel, T., C. R. Nelson, D. M. Theobald, G. C. Carnwath, and T. B. Chapman, 2009: Implementation of National Fire Plan treatments near the wildland–urban interface in the western United States. Proceedings of the National Academy of Sciences of the United States of America, 106 (26), 10706–10711. doi:10.1073/pnas.0900991106. ↩
- Searchinger, T., R. Edwards, D. Mulligan, R. Heimlich, and R. Plevin, 2015: Do biofuel policies seek to cut emissions by cutting food? Science, 347 (6229), 1420–1422. doi:10.1126/science.1261221. ↩
- Searchinger, T., R. Heimlich, R. A. Houghton, F. Dong, A. Elobeid, J. Fabiosa, S. Tokgoz, D. Hayes, and T.-H. Yu, 2008: Use of U.S. croplands for biofuels increases greenhouse gases through emissions from land-use change. Science, 319 (5867), 1238–1240. doi:10.1126/science.1151861. ↩
- Shafer, S. L., P. J. Bartlein, and R. S. Thompson, 2001: Potential changes in the distributions of western North America tree and shrub taxa under future climate scenarios. Ecosystems, 4 (3), 200–215. doi:10.1007/s10021-001-0004-5. ↩
- Shepherd, J. M., 2005: A review of current investigations of urban-induced rainfall and recommendations for the future. Earth Interactions, 9 (12), 1–27. doi:10.1175/EI156.1. ↩
- Sleeter, B. M., J. Liu, C. J. Daniel, T. J. Hawbaker, T. S. Wilson, L. B. Fortini, J. D. Jacobi, P. C. Selmants, C. P. Giardina, C. M. Litton, and R. F. Hughes, 2017: Projected future carbon storage and carbon fluxes in terrestrial ecosystems of Hawai‘i from changes in climate, land use, and disturbance. Baseline and Projected Future Carbon Storage and Carbon Fluxes in Ecosystems of Hawaiʻi. Selmants, P. C., C. P. Giardina, J. D. Jacobi, and Z. Zhu, Eds., U.S. Geological Survey, Reston, VA, 107–128. doi:10.3133/pp1834. ↩
- Sleeter, B. M., T. L. Sohl, T. R. Loveland, R. F. Auch, W. Acevedo, M. A. Drummond, K. L. Sayler, and S. V. Stehman, 2013: Land-cover change in the conterminous United States from 1973 to 2000. Global Environmental Change, 23 (4), 733–748. doi:10.1016/j.gloenvcha.2013.03.006. ↩
- Smyth, C. E., G. Stinson, E. Neilson, T. C. Lemprière, M. Hafer, G. J. Rampley, and W. A. Kurz, 2014: Quantifying the biophysical climate change mitigation potential of Canada's forest sector. Biogeosciences, 11 (13), 3515–3529. doi:10.5194/bg-11-3515-2014. ↩
- Sohl, T. L., M. C. Wimberly, V. C. Radeloff, D. M. Theobald, and B. M. Sleeter, 2016: Divergent projections of future land use in the United States arising from different models and scenarios. Ecological Modelling, 337, 281–297. doi:10.1016/j.ecolmodel.2016.07.016. ↩
- Sommers, W. T., R. A. Loehman, and C. C. Hardy, 2014: Wildland fire emissions, carbon, and climate: Science overview and knowledge needs. Forest Ecology and Management, 317, 1–8. doi:10.1016/j.foreco.2013.12.014. ↩
- Soulard, C. E., and T. S. Wilson, 2013: Recent land-use/land-cover change in the Central California Valley. Journal of Land Use Science, 10 (1), 59–80. doi:10.1080/1747423x.2013.841297. ↩
- Stephens, S. L., J. D. McIver, R. E. Boerner, C. J. Fettig, J. B. Fontaine, B. R. Hartsough, P. L. Kennedy, and D. W. Schwilk, 2012: The effects of forest fuel-reduction treatments in the United States. BioScience, 62 (6), 549–560. doi:10.1525/bio.2012.62.6.6. ↩
- Swanson, M. E., J. F. Franklin, R. L. Beschta, C. M. Crisafulli, D. A. DellaSala, R. L. Hutto, D. B. Lindenmayer, and F. J. Swanson, 2011: The forgotten stage of forest succession: Early-successional ecosystems on forest sites. Frontiers in Ecology and the Environment, 9 (2), 117–125. doi:10.1890/090157. ↩
- Taylor, J. L., W. Acevedo, R. F. Auch, and M. A. Drummond, 2015: Status and trends of land change in the Great Plains of the United States—1973 to 2000. USGS Professional Paper 1794-B. U.S. Geological Survey, Reston, VA, 179 pp. doi:10.3133/pp1794B. ↩
- The National Strategy, 2014: The National Strategy: The Final Phase in the Development of the National Cohesive Wildland Fire Management Strategy. U.S. Departments of the Interior and Agriculture, Washington, DC, 93 pp. URL. ↩
- Theobald, D. M., 2014: Development and applications of a comprehensive land use classification and map for the US. PLOS ONE, 9 (4), e94628. doi:10.1371/journal.pone.0094628. ↩
- Theobald, D. M., and W. H. Romme, 2007: Expansion of the US wildland-urban interface. Landscape and Urban Planning, 83 (4), 340–354. doi:10.1016/j.landurbplan.2007.06.002. ↩
- Thompson, R. S., 1988: Western North America: Vegetation dynamics in the western United States: Modes of response to climatic fluctuations. Vegetation History. Huntley, B., and T. Webb III, Eds., Kluwer Academic, Dordrecht, Netherlands, 415–458. ↩
- Thompson, R. S., K. H. Anderson, R. T. Pelltier, L. E. Strickland, S. L. Shafer, and P. J. Bartlein, 2012: Atlas of relations between climatic parameters and distributions of important trees and shrubs in North America—Modern data for climatic estimation from vegetation inventories. USGS Professional Paper 1650-F. U.S. Geological Survey, Reston, VA, various pp. URL. ↩
- Thomson, A. M., K. V. Calvin, S. J. Smith, G. P. Kyle, A. Volke, P. Patel, S. Delgado-Arias, B. Bond-Lamberty, M. A. Wise, and L. E. Clarke, 2011: RCP4.5: A pathway for stabilization of radiative forcing by 2100. Climatic Change, 109 (1–2), 77–94. doi:10.1007/s10584-011-0151-4. ↩
- Trainor, A. M., R. I. McDonald, and J. Fargione, 2016: Energy sprawl is the largest driver of land use change in United States. PLOS ONE, 11 (9), e0162269. doi:10.1371/journal.pone.0162269. ↩
- USGCRP, 2017: Climate Science Special Report: Fourth National Climate Assessment, Volume I. Wuebbles, D. J., D. W. Fahey, K. A. Hibbard, D. J. Dokken, B. C. Stewart, and T. K. Maycock, Eds. U.S. Global Change Research Program, Washington, DC, USA, 470 pp. doi:10.7930/J0J964J6. ↩
- USGCRP, 2018: Second State of the Carbon Cycle Report (SOCCR2): A Sustained Assessment Report. U.S. Global Change Research Program, Washington, DC, 877 pp. URL. ↩
- van Vuuren, D. P., S. Deetman, M. G. J. den Elzen, A. Hof, M. Isaac, K. Klein Goldewijk, T. Kram, A. Mendoza Beltran, E. Stehfest, and J. van Vliet, 2011: RCP2.6: Exploring the possibility to keep global mean temperature increase below 2° C. Climatic Change, 109 (1–2), 95–116. doi:10.1007/s10584-011-0152-3. ↩
- Verburg, P. H., K. Neumann, and L. Nol, 2011: Challenges in using land use and land cover data for global change studies. Global Change Biology, 17 (2), 974–989. doi:10.1111/j.1365-2486.2010.02307.x. ↩
- Vitousek, S., P. L. Barnard, C. H. Fletcher, N. Frazer, L. Erikson, and C. D. Storlazzi, 2017: Doubling of coastal flooding frequency within decades due to sea-level rise. Scientific Reports, 7 (1), 1399. doi:10.1038/s41598-017-01362-7. ↩
- Westerling, A. L., 2016: Increasing western US forest wildfire activity: Sensitivity to changes in the timing of spring. Philosophical Transactions of the Royal Society B: Biological Sciences, 371, 20150178. doi:10.1098/rstb.2015.0178. ↩
- Westerling, A. L., H. G. Hidalgo, D. R. Cayan, and T. W. Swetnam, 2006: Warming and earlier spring increase western U.S. forest wildfire activity. Science, 313 (5789), 940–943. doi:10.1126/science.1128834. ↩
- Wheeler, T., and J. von Braun, 2013: Climate change impacts on global food security. Science, 341 (6145), 508–513. doi:10.1126/science.1239402. ↩
- Wickham, J. D., T. G. Wade, and K. H. Riitters, 2012: Comparison of cropland and forest surface temperatures across the conterminous United States. Agricultural and Forest Meteorology, 166, 137–143. doi:10.1016/j.agrformet.2012.07.002. ↩
- Wickham, J. D., T. G. Wade, and K. H. Riitters, 2013: Empirical analysis of the influence of forest extent on annual and seasonal surface temperatures for the continental United States. Global Ecology and Biogeography, 22 (5), 620–629. doi:10.1111/geb.12013. ↩
- Wickham, J., C. Barnes, M. Nash, and T. Wade, 2015: Combining NLCD and MODIS to create a land cover-albedo database for the continental United States. Remote Sensing of Environment, 170, 143–152. doi:10.1016/j.rse.2015.09.012. ↩
- Wickham, J., M. Nash, and C. A. Barnes, 2016: Effect of land cover change on snow free surface albedo across the continental United States. Global and Planetary Change, 146, 1–9. doi:10.1016/j.gloplacha.2016.09.005. ↩
- Wickham, J., T. Wade, and K. Riitters, 2014: An isoline separating relatively warm from relatively cool wintertime forest surface temperatures for the southeastern United States. Global and Planetary Change, 120, 46–53. doi:10.1016/j.gloplacha.2014.05.012. ↩
- Williams, A. P., and J. T. Abatzoglou, 2016: Recent advances and remaining uncertainties in resolving past and future climate effects on global fire activity. Current Climate Change Reports, 2 (1), 1–14. doi:10.1007/s40641-016-0031-0. ↩
- Williams, A. P., C. D. Allen, C. I. Millar, T. W. Swetnam, J. Michaelsen, C. J. Still, and S. W. Leavitt, 2010: Forest responses to increasing aridity and warmth in the southwestern United States. Proceedings of the National Academy of Sciences of the United States of America, 107 (50), 21289–21294. doi:10.1073/pnas.0914211107. ↩
- Williams, A. P., R. Seager, J. T. Abatzoglou, B. I. Cook, J. E. Smerdon, and E. R. Cook, 2015: Contribution of anthropogenic warming to California drought during 2012–2014. Geophysical Research Letters, 42 (16), 6819–6828. doi:10.1002/2015GL064924. ↩
- Wilson, T. S., B. M. Sleeter, and D. R. Cameron, 2016: Future land-use related water demand in California. Environmental Research Letters, 11 (5), 054018. doi:10.1088/1748-9326/11/5/054018. ↩
- Woodall, C. W., B. F. Walters, M. B. Russell, J. W. Coulston, G. M. Domke, A. W. D'Amato, and P. A. Sowers, 2016: A tale of two forest carbon assessments in the eastern United States: Forest use versus cover as a metric of change. Ecosystems, 19 (8), 1401–1417. doi:10.1007/s10021-016-0012-0. ↩
- Wright, C. K., and M. C. Wimberly, 2013: Recent land use change in the Western Corn Belt threatens grasslands and wetlands. Proceedings of the National Academy of Sciences of the United States of America, 110 (10), 4134–4139. doi:10.1073/pnas.1215404110. ↩
- Xu, C., G. Z. Gertner, and R. M. Scheller, 2007: Potential effects of interaction between CO2 and temperature on forest landscape response to global warming. Global Change Biology, 13 (7), 1469–1483. doi:10.1111/j.1365-2486.2007.01387.x. ↩
- Yang, X., Y. Hou, and B. Chen, 2011: Observed surface warming induced by urbanization in east China. Journal of Geophysical Research, 116 (D14), D14113. doi:10.1029/2010JD015452. ↩
- Young, D. J., J. T. Stevens, J. M. Earles, J. Moore, A. Ellis, A. L. Jirka, and A. M. Latimer, 2017: Long‐term climate and competition explain forest mortality patterns under extreme drought. Ecology Letters, 20 (1), 78–86. doi:10.1111/ele.12711. ↩
- Yue, X., L. J. Mickley, and J. A. Logan, 2014: Projection of wildfire activity in Southern California in the mid-twenty-first century. Climate Dynamics, 43 (7–8), 1973–1991. doi:10.1007/s00382-013-2022-3. ↩
- Zabel, F., B. Putzenlechner, and W. Mauser, 2014: Global agricultural land resources—A high resolution suitability evaluation and its perspectives until 2100 under climate change conditions. PLOS ONE, 9 (9), e107522. doi:10.1371/journal.pone.0107522. ↩
- Zhao, K., and R. B. Jackson, 2014: Biophysical forcings of land‐use changes from potential forestry activities in North America. Ecological Monographs, 84 (2), 329–353. doi:10.1890/12-1705.1. ↩
- Zhao, L., X. Lee, R. B. Smith, and K. Oleson, 2014: Strong contributions of local background climate to urban heat islands. Nature, 511 (7508), 216–219. doi:10.1038/nature13462. ↩
- Zhao, M., A. J. Pitman, and T. Chase, 2001: The impact of land cover change on the atmospheric circulation. Climate Dynamics, 17 (5), 467–477. doi:10.1007/pl00013740. ↩
- Zhou, L., R. E. Dickinson, Y. Tian, J. Fang, Q. Li, R. K. Kaufmann, C. J. Tucker, and R. B. Myneni, 2004: Evidence for a significant urbanization effect on climate in China. Proceedings of the National Academy of Sciences of the United States of America, 101 (26), 9540–9544. doi:10.1890/12-1705.1. ↩
